29
/
en
AIzaSyAYiBZKx7MnpbEhh9jyipgxe19OcubqV5w
April 1, 2024
169363
Korea, Dem. People’s Rep.
PRK
true
2
1
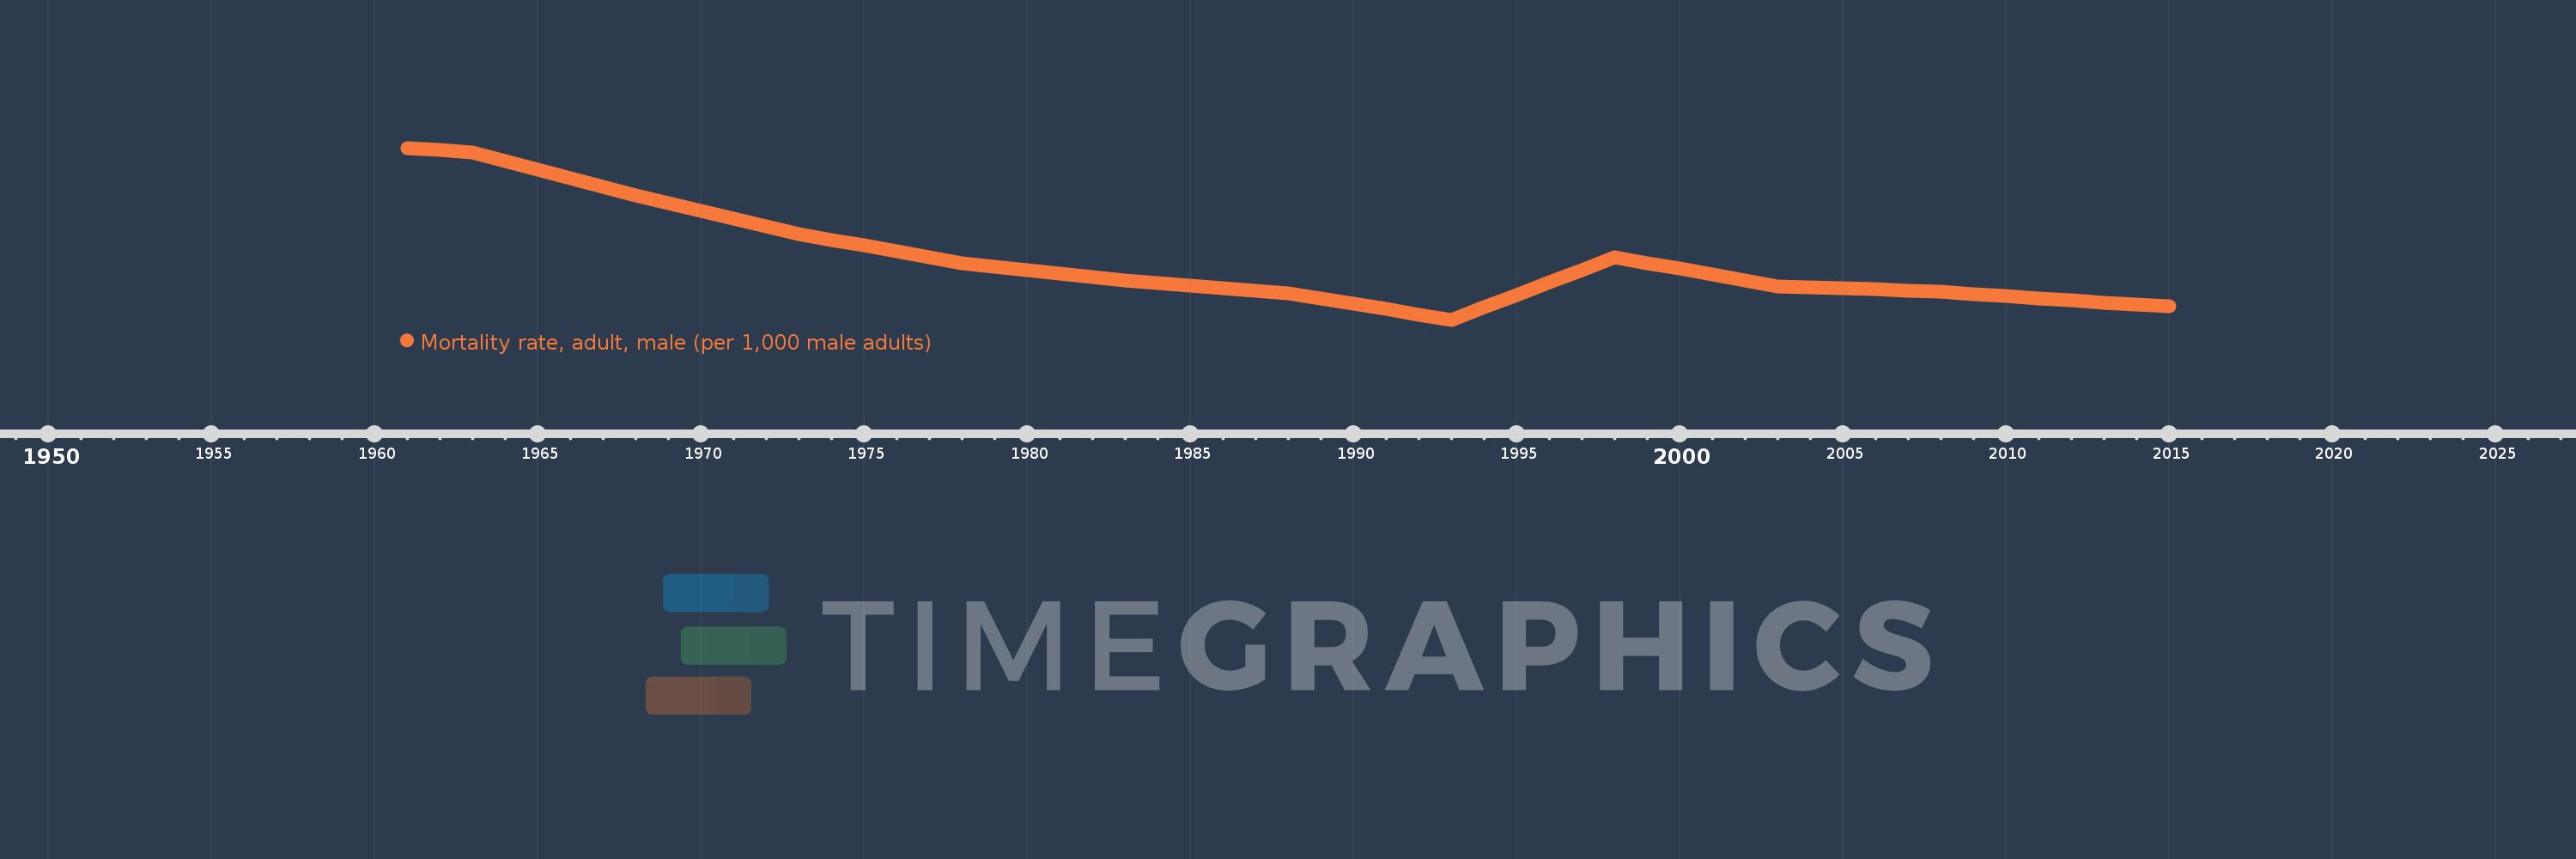
Mortality rate, adult, male (per 1,000 male adults)
2015,2014,2013,2012,2011,2010,2009,2008,2007,2006,2005,2004,2003,2002,2001,2000,1999,1998,1997,1996,1995,1994,1993,1992,1991,1990,1989,1988,1987,1986,1985,1984,1983,1982,1981,1980,1979,1978,1977,1976,1975,1974,1973,1972,1971,1970,1969,1968,1967,1966,1965,1964,1963,1962,1961
This statistics in other country:
AfghanistanAlbaniaAlgeriaAngolaAntigua and BarbudaArab WorldArgentinaArmeniaArubaAustraliaAustriaAzerbaijanBahamas, TheBahrainBangladeshBarbadosBelarusBelgiumBelizeBeninBhutanBoliviaBosnia and HerzegovinaBotswanaBrazilBrunei DarussalamBulgariaBurkina FasoBurundiCabo VerdeCambodiaCameroonCanadaCaribbean small statesCentral African RepublicCentral Europe and the BalticsChadChannel IslandsChileChinaColombiaComorosCongo, Dem. Rep.Congo, Rep.Costa RicaCote d'IvoireCroatiaCubaCuracaoCyprusCzech RepublicDenmarkDjiboutiDominicaDominican RepublicEarly-demographic dividendEast Asia & PacificEast Asia & Pacific (excluding high income)East Asia & Pacific (IDA & IBRD countries)EcuadorEgypt, Arab Rep.El SalvadorEquatorial GuineaEritreaEstoniaEthiopiaEuro areaEurope & Central AsiaEurope & Central Asia (excluding high income)Europe & Central Asia (IDA & IBRD countries)European UnionFijiFinlandFragile and conflict affected situationsFranceFrench PolynesiaGabonGambia, TheGeorgiaGermanyGhanaGreeceGreenlandGrenadaGuamGuatemalaGuineaGuinea-BissauGuyanaHaitiHeavily indebted poor countries (HIPC)High incomeHondurasHong Kong SAR, ChinaHungaryIBRD onlyIcelandIDA & IBRD totalIDA blendIDA onlyIDA totalIndiaIndonesiaIran, Islamic Rep.IraqIrelandIsraelItalyJamaicaJapanJordanKazakhstanKenyaKiribatiKorea, Dem. People’s Rep.Korea, Rep.KuwaitKyrgyz RepublicLao PDRLate-demographic dividendLatin America & Caribbean Latin America & Caribbean (excluding high income)Latin America & the Caribbean (IDA & IBRD countries)LatviaLeast developed countries: UN classificationLebanonLesothoLiberiaLibyaLithuaniaLow & middle incomeLow incomeLower middle incomeLuxembourgMacao SAR, ChinaMacedonia, FYRMadagascarMalawiMalaysiaMaldivesMaliMaltaMarshall IslandsMauritaniaMauritiusMexicoMicronesia, Fed. Sts.Middle East & North AfricaMiddle East & North Africa (excluding high income)Middle East & North Africa (IDA & IBRD countries)Middle incomeMoldovaMongoliaMontenegroMoroccoMozambiqueMyanmarNamibiaNepalNetherlandsNew CaledoniaNew ZealandNicaraguaNigerNigeriaNorth AmericaNorwayOECD membersOmanOther small statesPacific island small statesPakistanPanamaPapua New GuineaParaguayPeruPhilippinesPolandPortugalPost-demographic dividendPre-demographic dividendPuerto RicoQatarRomaniaRussian FederationRwandaSamoaSao Tome and PrincipeSaudi ArabiaSenegalSerbiaSeychellesSierra LeoneSingaporeSlovak RepublicSloveniaSmall statesSolomon IslandsSomaliaSouth AfricaSouth AsiaSouth Asia (IDA & IBRD)South SudanSpainSri LankaSt. Kitts and NevisSt. LuciaSt. Vincent and the GrenadinesSub-Saharan Africa Sub-Saharan Africa (excluding high income)Sub-Saharan Africa (IDA & IBRD countries)SudanSurinameSwazilandSwedenSwitzerlandSyrian Arab RepublicTajikistanTanzaniaThailandTimor-LesteTogoTongaTrinidad and TobagoTunisiaTurkeyTurkmenistanUgandaUkraineUnited Arab EmiratesUnited KingdomUnited StatesUpper middle incomeUruguayUzbekistanVanuatuVenezuela, RBVietnamVirgin Islands (U.S.)West Bank and GazaWorldYemen, Rep.ZambiaZimbabwe Timeline:
This timeline shows a graph from 1961 to 2015 of Korea, Dem. People’s Rep.. No data until 1960. Number of actual observations by date: 55.
Source name:
World Development Indicators
Source organization:
(1) United Nations Population Division. World Population Prospects. New York, United Nations, Department of Economic and Social Affairs (advanced Excel tables). Available at http://esa.un.org/wpp/unpp/panel_population.htm, (2) University of California, Berkeley, and Max Planck Institute for Demographic Research. Human Mortality Database. [ www.mortality.org or www.humanmortality.de].
Categories, topics:
Health, Gender
Last updated:
apr 23, 2017
Indicators value changes by year
Minimum:
152.916
jan 1, 1993
Maximum:
452.276
jan 1, 1961
At the date of observation
Value
Absolute change
Change from previous value
jan 1, 1961
452.276
+452.276
0.0%
jan 1, 1962
448.358
-3.918
-0.87%
jan 1, 1963
444.439
-3.919
-0.87%
jan 1, 1964
429.336
-15.103
-3.4%
jan 1, 1965
414.233
-15.103
-3.52%
jan 1, 1966
399.13
-15.103
-3.65%
jan 1, 1967
384.027
-15.103
-3.78%
jan 1, 1968
368.923
-15.104
-3.93%
jan 1, 1969
355.568
-13.355
-3.62%
jan 1, 1970
342.212
-13.356
-3.76%
jan 1, 1971
328.857
-13.355
-3.9%
jan 1, 1972
315.501
-13.356
-4.06%
jan 1, 1973
302.145
-13.356
-4.23%
jan 1, 1974
292.086
-10.059
-3.33%
jan 1, 1975
282.027
-10.059
-3.44%
jan 1, 1976
271.968
-10.059
-3.57%
jan 1, 1977
261.909
-10.059
-3.7%
jan 1, 1978
251.851
-10.058
-3.84%
jan 1, 1979
245.691
-6.16
-2.45%
jan 1, 1980
239.531
-6.16
-2.51%
jan 1, 1981
233.371
-6.16
-2.57%
jan 1, 1982
227.211
-6.16
-2.64%
jan 1, 1983
221.051
-6.16
-2.71%
jan 1, 1984
216.566
-4.485
-2.03%
jan 1, 1985
212.081
-4.485
-2.07%
jan 1, 1986
207.597
-4.484
-2.11%
jan 1, 1987
203.112
-4.485
-2.16%
jan 1, 1988
198.627
-4.485
-2.21%
jan 1, 1989
189.485
-9.142
-4.6%
jan 1, 1990
180.343
-9.142
-4.82%
jan 1, 1991
171.2
-9.143
-5.07%
jan 1, 1992
162.058
-9.142
-5.34%
jan 1, 1993
152.916
-9.142
-5.64%
jan 1, 1994
174.688
+21.772
14.24%
jan 1, 1995
196.46
+21.772
12.46%
jan 1, 1996
218.231
+21.771
11.08%
jan 1, 1997
240.003
+21.772
9.98%
jan 1, 1998
261.775
+21.772
9.07%
jan 1, 1999
251.666
-10.109
-3.86%
jan 1, 2000
241.557
-10.109
-4.02%
jan 1, 2001
231.448
-10.109
-4.18%
jan 1, 2002
221.339
-10.109
-4.37%
jan 1, 2003
211.23
-10.109
-4.57%
jan 1, 2004
209.367
-1.863
-0.88%
jan 1, 2005
207.505
-1.862
-0.89%
jan 1, 2006
205.642
-1.863
-0.9%
jan 1, 2007
203.779
-1.863
-0.91%
jan 1, 2008
201.917
-1.862
-0.91%
jan 1, 2009
198.112
-3.805
-1.88%
jan 1, 2010
194.308
-3.804
-1.92%
jan 1, 2011
190.503
-3.805
-1.96%
jan 1, 2012
186.699
-3.804
-2.0%
jan 1, 2013
182.894
-3.805
-2.04%
jan 1, 2014
179.367
-3.527
-1.93%
jan 1, 2015
175.841
-3.526
-1.97%
Ranking of countries by current statistics by years


Comments: