29
/
en
AIzaSyAYiBZKx7MnpbEhh9jyipgxe19OcubqV5w
April 1, 2024
266019
Tonga
TON
true
2
1
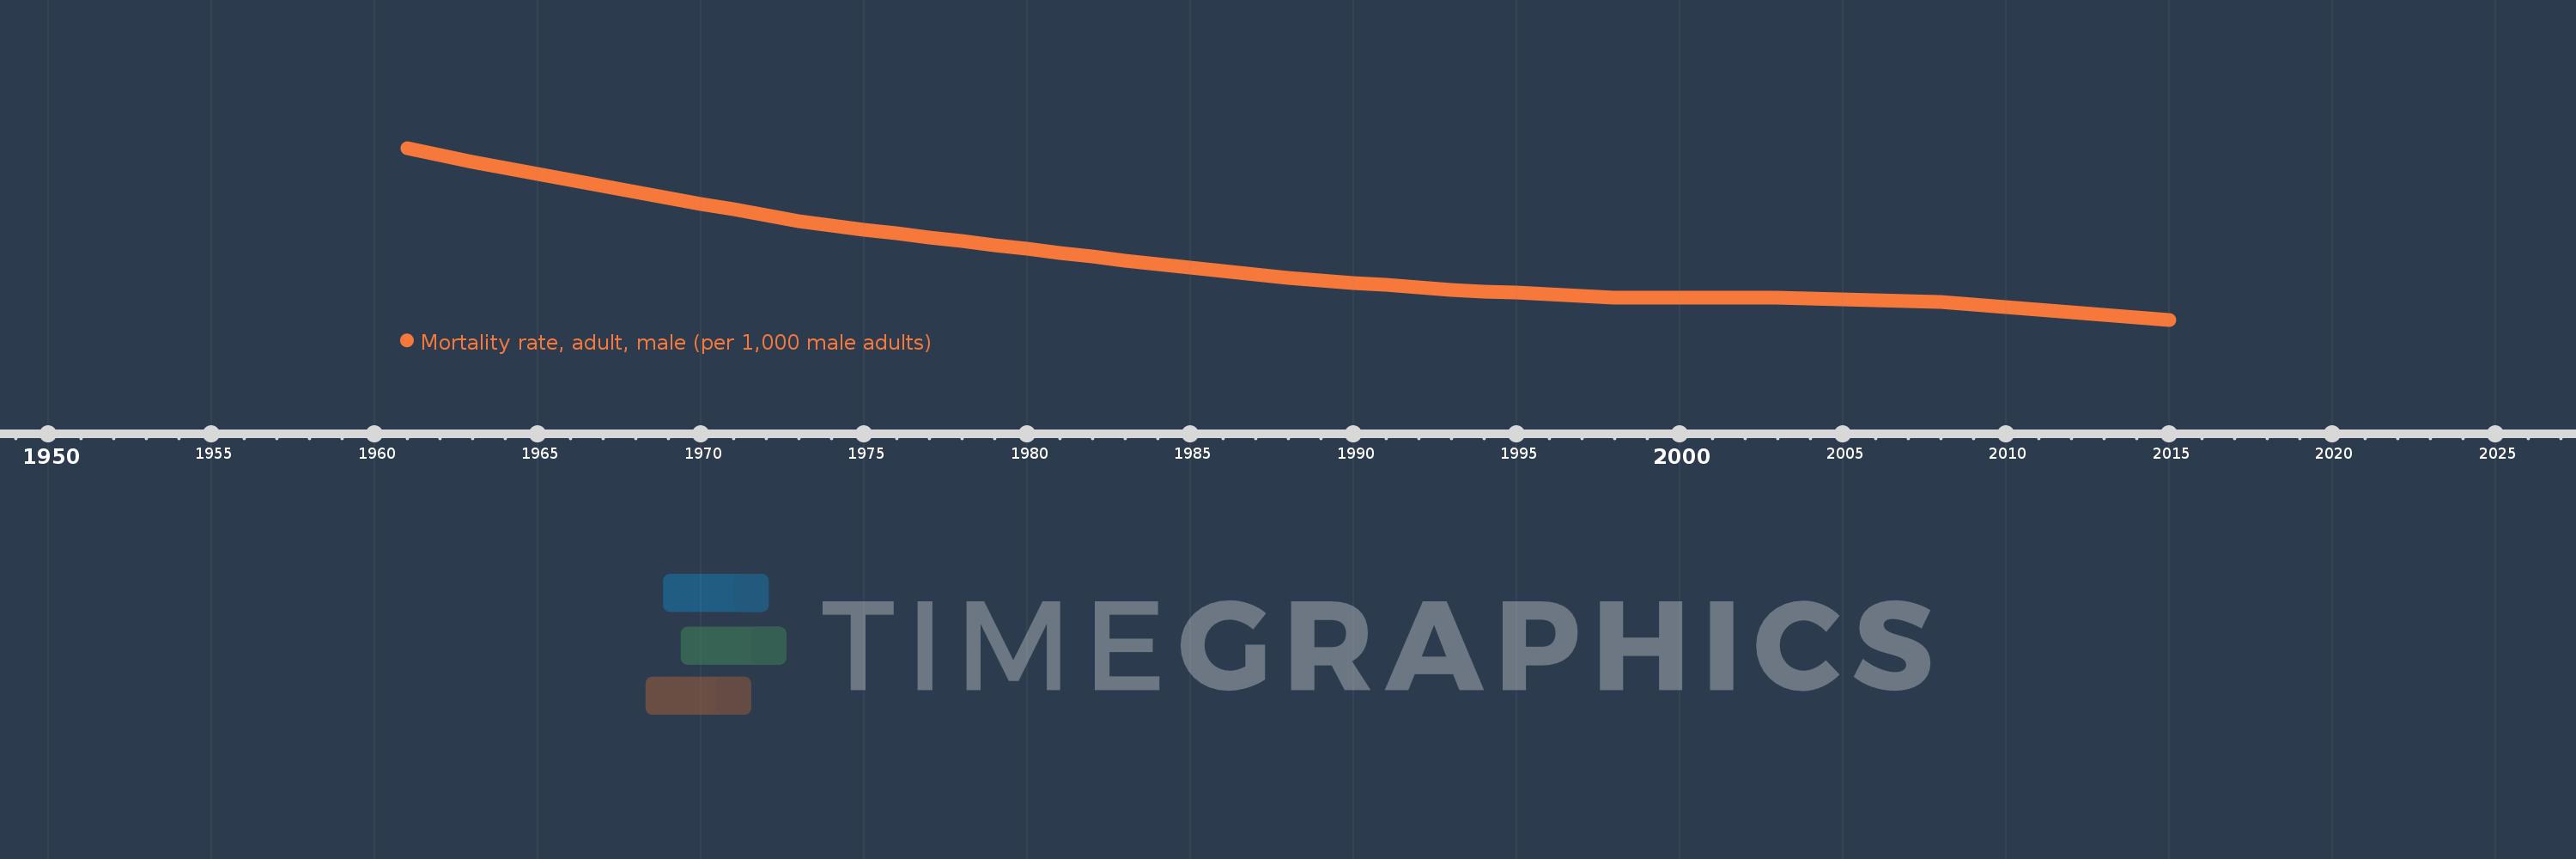
Mortality rate, adult, male (per 1,000 male adults)
2015,2014,2013,2012,2011,2010,2009,2008,2007,2006,2005,2004,2003,2002,2001,2000,1999,1998,1997,1996,1995,1994,1993,1992,1991,1990,1989,1988,1987,1986,1985,1984,1983,1982,1981,1980,1979,1978,1977,1976,1975,1974,1973,1972,1971,1970,1969,1968,1967,1966,1965,1964,1963,1962,1961
This statistics in other country:
AfghanistanAlbaniaAlgeriaAngolaAntigua and BarbudaArab WorldArgentinaArmeniaArubaAustraliaAustriaAzerbaijanBahamas, TheBahrainBangladeshBarbadosBelarusBelgiumBelizeBeninBhutanBoliviaBosnia and HerzegovinaBotswanaBrazilBrunei DarussalamBulgariaBurkina FasoBurundiCabo VerdeCambodiaCameroonCanadaCaribbean small statesCentral African RepublicCentral Europe and the BalticsChadChannel IslandsChileChinaColombiaComorosCongo, Dem. Rep.Congo, Rep.Costa RicaCote d'IvoireCroatiaCubaCuracaoCyprusCzech RepublicDenmarkDjiboutiDominicaDominican RepublicEarly-demographic dividendEast Asia & PacificEast Asia & Pacific (excluding high income)East Asia & Pacific (IDA & IBRD countries)EcuadorEgypt, Arab Rep.El SalvadorEquatorial GuineaEritreaEstoniaEthiopiaEuro areaEurope & Central AsiaEurope & Central Asia (excluding high income)Europe & Central Asia (IDA & IBRD countries)European UnionFijiFinlandFragile and conflict affected situationsFranceFrench PolynesiaGabonGambia, TheGeorgiaGermanyGhanaGreeceGreenlandGrenadaGuamGuatemalaGuineaGuinea-BissauGuyanaHaitiHeavily indebted poor countries (HIPC)High incomeHondurasHong Kong SAR, ChinaHungaryIBRD onlyIcelandIDA & IBRD totalIDA blendIDA onlyIDA totalIndiaIndonesiaIran, Islamic Rep.IraqIrelandIsraelItalyJamaicaJapanJordanKazakhstanKenyaKiribatiKorea, Dem. People’s Rep.Korea, Rep.KuwaitKyrgyz RepublicLao PDRLate-demographic dividendLatin America & Caribbean Latin America & Caribbean (excluding high income)Latin America & the Caribbean (IDA & IBRD countries)LatviaLeast developed countries: UN classificationLebanonLesothoLiberiaLibyaLithuaniaLow & middle incomeLow incomeLower middle incomeLuxembourgMacao SAR, ChinaMacedonia, FYRMadagascarMalawiMalaysiaMaldivesMaliMaltaMarshall IslandsMauritaniaMauritiusMexicoMicronesia, Fed. Sts.Middle East & North AfricaMiddle East & North Africa (excluding high income)Middle East & North Africa (IDA & IBRD countries)Middle incomeMoldovaMongoliaMontenegroMoroccoMozambiqueMyanmarNamibiaNepalNetherlandsNew CaledoniaNew ZealandNicaraguaNigerNigeriaNorth AmericaNorwayOECD membersOmanOther small statesPacific island small statesPakistanPanamaPapua New GuineaParaguayPeruPhilippinesPolandPortugalPost-demographic dividendPre-demographic dividendPuerto RicoQatarRomaniaRussian FederationRwandaSamoaSao Tome and PrincipeSaudi ArabiaSenegalSerbiaSeychellesSierra LeoneSingaporeSlovak RepublicSloveniaSmall statesSolomon IslandsSomaliaSouth AfricaSouth AsiaSouth Asia (IDA & IBRD)South SudanSpainSri LankaSt. Kitts and NevisSt. LuciaSt. Vincent and the GrenadinesSub-Saharan Africa Sub-Saharan Africa (excluding high income)Sub-Saharan Africa (IDA & IBRD countries)SudanSurinameSwazilandSwedenSwitzerlandSyrian Arab RepublicTajikistanTanzaniaThailandTimor-LesteTogoTongaTrinidad and TobagoTunisiaTurkeyTurkmenistanUgandaUkraineUnited Arab EmiratesUnited KingdomUnited StatesUpper middle incomeUruguayUzbekistanVanuatuVenezuela, RBVietnamVirgin Islands (U.S.)West Bank and GazaWorldYemen, Rep.ZambiaZimbabwe Timeline:
This timeline shows a graph from 1961 to 2015 of Tonga. No data until 1960. Number of actual observations by date: 55.
Source name:
World Development Indicators
Source organization:
(1) United Nations Population Division. World Population Prospects. New York, United Nations, Department of Economic and Social Affairs (advanced Excel tables). Available at http://esa.un.org/wpp/unpp/panel_population.htm, (2) University of California, Berkeley, and Max Planck Institute for Demographic Research. Human Mortality Database. [ www.mortality.org or www.humanmortality.de].
Categories, topics:
Health, Gender
Last updated:
apr 23, 2017
Indicators value changes by year
Minimum:
166.562
jan 1, 2015
Maximum:
303.882
jan 1, 1961
At the date of observation
Value
Absolute change
Change from previous value
jan 1, 1961
303.882
+303.882
0.0%
jan 1, 1962
298.41
-5.472
-1.8%
jan 1, 1963
292.938
-5.472
-1.83%
jan 1, 1964
288.13
-4.808
-1.64%
jan 1, 1965
283.323
-4.807
-1.67%
jan 1, 1966
278.515
-4.808
-1.7%
jan 1, 1967
273.707
-4.808
-1.73%
jan 1, 1968
268.9
-4.807
-1.76%
jan 1, 1969
264.131
-4.769
-1.77%
jan 1, 1970
259.363
-4.768
-1.81%
jan 1, 1971
254.594
-4.769
-1.84%
jan 1, 1972
249.826
-4.768
-1.87%
jan 1, 1973
245.058
-4.768
-1.91%
jan 1, 1974
241.912
-3.146
-1.28%
jan 1, 1975
238.766
-3.146
-1.3%
jan 1, 1976
235.62
-3.146
-1.32%
jan 1, 1977
232.474
-3.146
-1.34%
jan 1, 1978
229.329
-3.145
-1.35%
jan 1, 1979
226.218
-3.111
-1.36%
jan 1, 1980
223.107
-3.111
-1.38%
jan 1, 1981
219.996
-3.111
-1.39%
jan 1, 1982
216.885
-3.111
-1.41%
jan 1, 1983
213.774
-3.111
-1.43%
jan 1, 1984
210.986
-2.788
-1.3%
jan 1, 1985
208.198
-2.788
-1.32%
jan 1, 1986
205.41
-2.788
-1.34%
jan 1, 1987
202.623
-2.787
-1.36%
jan 1, 1988
199.835
-2.788
-1.38%
jan 1, 1989
197.979
-1.856
-0.93%
jan 1, 1990
196.124
-1.855
-0.94%
jan 1, 1991
194.269
-1.855
-0.95%
jan 1, 1992
192.414
-1.855
-0.95%
jan 1, 1993
190.558
-1.856
-0.96%
jan 1, 1994
189.323
-1.235
-0.65%
jan 1, 1995
188.088
-1.235
-0.65%
jan 1, 1996
186.853
-1.235
-0.66%
jan 1, 1997
185.618
-1.235
-0.66%
jan 1, 1998
184.383
-1.235
-0.67%
jan 1, 1999
184.312
-0.071
-0.04%
jan 1, 2000
184.241
-0.071
-0.04%
jan 1, 2001
184.17
-0.071
-0.04%
jan 1, 2002
184.098
-0.072
-0.04%
jan 1, 2003
184.027
-0.071
-0.04%
jan 1, 2004
183.328
-0.699
-0.38%
jan 1, 2005
182.629
-0.699
-0.38%
jan 1, 2006
181.93
-0.699
-0.38%
jan 1, 2007
181.231
-0.699
-0.38%
jan 1, 2008
180.531
-0.7
-0.39%
jan 1, 2009
178.555
-1.976
-1.09%
jan 1, 2010
176.578
-1.977
-1.11%
jan 1, 2011
174.601
-1.977
-1.12%
jan 1, 2012
172.624
-1.977
-1.13%
jan 1, 2013
170.648
-1.976
-1.14%
jan 1, 2014
168.605
-2.043
-1.2%
jan 1, 2015
166.562
-2.043
-1.21%
Ranking of countries by current statistics by years


Comments: