29
/
en
AIzaSyAYiBZKx7MnpbEhh9jyipgxe19OcubqV5w
April 1, 2024
199458
Mongolia
MNG
true
2
1
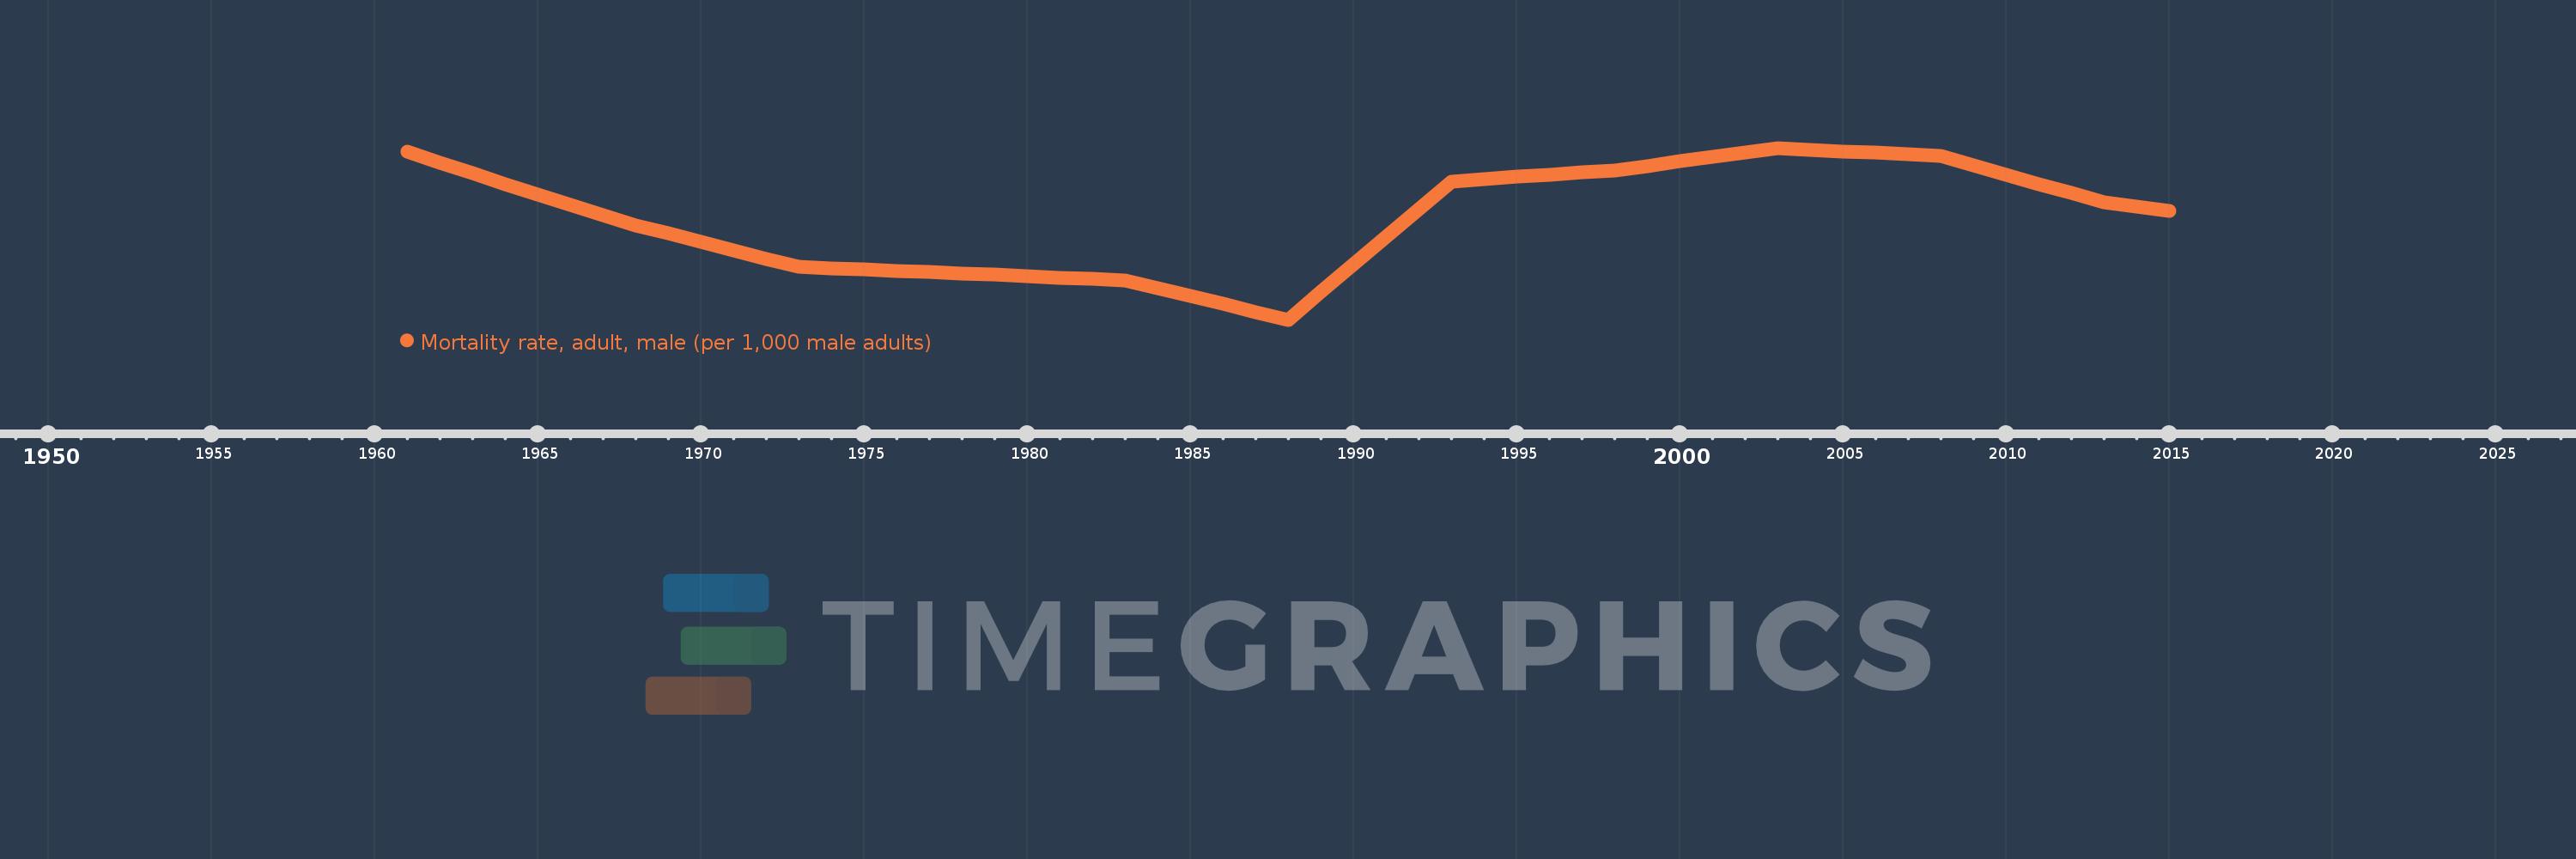
Mortality rate, adult, male (per 1,000 male adults)
2015,2014,2013,2012,2011,2010,2009,2008,2007,2006,2005,2004,2003,2002,2001,2000,1999,1998,1997,1996,1995,1994,1993,1992,1991,1990,1989,1988,1987,1986,1985,1984,1983,1982,1981,1980,1979,1978,1977,1976,1975,1974,1973,1972,1971,1970,1969,1968,1967,1966,1965,1964,1963,1962,1961
This statistics in other country:
AfghanistanAlbaniaAlgeriaAngolaAntigua and BarbudaArab WorldArgentinaArmeniaArubaAustraliaAustriaAzerbaijanBahamas, TheBahrainBangladeshBarbadosBelarusBelgiumBelizeBeninBhutanBoliviaBosnia and HerzegovinaBotswanaBrazilBrunei DarussalamBulgariaBurkina FasoBurundiCabo VerdeCambodiaCameroonCanadaCaribbean small statesCentral African RepublicCentral Europe and the BalticsChadChannel IslandsChileChinaColombiaComorosCongo, Dem. Rep.Congo, Rep.Costa RicaCote d'IvoireCroatiaCubaCuracaoCyprusCzech RepublicDenmarkDjiboutiDominicaDominican RepublicEarly-demographic dividendEast Asia & PacificEast Asia & Pacific (excluding high income)East Asia & Pacific (IDA & IBRD countries)EcuadorEgypt, Arab Rep.El SalvadorEquatorial GuineaEritreaEstoniaEthiopiaEuro areaEurope & Central AsiaEurope & Central Asia (excluding high income)Europe & Central Asia (IDA & IBRD countries)European UnionFijiFinlandFragile and conflict affected situationsFranceFrench PolynesiaGabonGambia, TheGeorgiaGermanyGhanaGreeceGreenlandGrenadaGuamGuatemalaGuineaGuinea-BissauGuyanaHaitiHeavily indebted poor countries (HIPC)High incomeHondurasHong Kong SAR, ChinaHungaryIBRD onlyIcelandIDA & IBRD totalIDA blendIDA onlyIDA totalIndiaIndonesiaIran, Islamic Rep.IraqIrelandIsraelItalyJamaicaJapanJordanKazakhstanKenyaKiribatiKorea, Dem. People’s Rep.Korea, Rep.KuwaitKyrgyz RepublicLao PDRLate-demographic dividendLatin America & Caribbean Latin America & Caribbean (excluding high income)Latin America & the Caribbean (IDA & IBRD countries)LatviaLeast developed countries: UN classificationLebanonLesothoLiberiaLibyaLithuaniaLow & middle incomeLow incomeLower middle incomeLuxembourgMacao SAR, ChinaMacedonia, FYRMadagascarMalawiMalaysiaMaldivesMaliMaltaMarshall IslandsMauritaniaMauritiusMexicoMicronesia, Fed. Sts.Middle East & North AfricaMiddle East & North Africa (excluding high income)Middle East & North Africa (IDA & IBRD countries)Middle incomeMoldovaMongoliaMontenegroMoroccoMozambiqueMyanmarNamibiaNepalNetherlandsNew CaledoniaNew ZealandNicaraguaNigerNigeriaNorth AmericaNorwayOECD membersOmanOther small statesPacific island small statesPakistanPanamaPapua New GuineaParaguayPeruPhilippinesPolandPortugalPost-demographic dividendPre-demographic dividendPuerto RicoQatarRomaniaRussian FederationRwandaSamoaSao Tome and PrincipeSaudi ArabiaSenegalSerbiaSeychellesSierra LeoneSingaporeSlovak RepublicSloveniaSmall statesSolomon IslandsSomaliaSouth AfricaSouth AsiaSouth Asia (IDA & IBRD)South SudanSpainSri LankaSt. Kitts and NevisSt. LuciaSt. Vincent and the GrenadinesSub-Saharan Africa Sub-Saharan Africa (excluding high income)Sub-Saharan Africa (IDA & IBRD countries)SudanSurinameSwazilandSwedenSwitzerlandSyrian Arab RepublicTajikistanTanzaniaThailandTimor-LesteTogoTongaTrinidad and TobagoTunisiaTurkeyTurkmenistanUgandaUkraineUnited Arab EmiratesUnited KingdomUnited StatesUpper middle incomeUruguayUzbekistanVanuatuVenezuela, RBVietnamVirgin Islands (U.S.)West Bank and GazaWorldYemen, Rep.ZambiaZimbabwe Timeline:
This timeline shows a graph from 1961 to 2015 of Mongolia. No data until 1960. Number of actual observations by date: 55.
Source name:
World Development Indicators
Source organization:
(1) United Nations Population Division. World Population Prospects. New York, United Nations, Department of Economic and Social Affairs (advanced Excel tables). Available at http://esa.un.org/wpp/unpp/panel_population.htm, (2) University of California, Berkeley, and Max Planck Institute for Demographic Research. Human Mortality Database. [ www.mortality.org or www.humanmortality.de].
Categories, topics:
Health, Gender
Last updated:
apr 23, 2017
Indicators value changes by year
Minimum:
240.403
jan 1, 1988
Maximum:
334.06
jan 1, 2003
At the date of observation
Value
Absolute change
Change from previous value
jan 1, 1961
332.033
+332.033
0.0%
jan 1, 1962
326.078
-5.955
-1.79%
jan 1, 1963
320.124
-5.954
-1.83%
jan 1, 1964
314.485
-5.639
-1.76%
jan 1, 1965
308.845
-5.64
-1.79%
jan 1, 1966
303.206
-5.639
-1.83%
jan 1, 1967
297.567
-5.639
-1.86%
jan 1, 1968
291.928
-5.639
-1.9%
jan 1, 1969
287.364
-4.564
-1.56%
jan 1, 1970
282.801
-4.563
-1.59%
jan 1, 1971
278.238
-4.563
-1.61%
jan 1, 1972
273.674
-4.564
-1.64%
jan 1, 1973
269.111
-4.563
-1.67%
jan 1, 1974
268.425
-0.686
-0.25%
jan 1, 1975
267.74
-0.685
-0.26%
jan 1, 1976
267.054
-0.686
-0.26%
jan 1, 1977
266.368
-0.686
-0.26%
jan 1, 1978
265.683
-0.685
-0.26%
jan 1, 1979
264.896
-0.787
-0.3%
jan 1, 1980
264.109
-0.787
-0.3%
jan 1, 1981
263.322
-0.787
-0.3%
jan 1, 1982
262.535
-0.787
-0.3%
jan 1, 1983
261.748
-0.787
-0.3%
jan 1, 1984
257.479
-4.269
-1.63%
jan 1, 1985
253.21
-4.269
-1.66%
jan 1, 1986
248.941
-4.269
-1.69%
jan 1, 1987
244.672
-4.269
-1.71%
jan 1, 1988
240.403
-4.269
-1.74%
jan 1, 1989
255.486
+15.083
6.27%
jan 1, 1990
270.568
+15.082
5.9%
jan 1, 1991
285.651
+15.083
5.57%
jan 1, 1992
300.734
+15.083
5.28%
jan 1, 1993
315.817
+15.083
5.02%
jan 1, 1994
317.03
+1.213
0.38%
jan 1, 1995
318.244
+1.214
0.38%
jan 1, 1996
319.457
+1.213
0.38%
jan 1, 1997
320.671
+1.214
0.38%
jan 1, 1998
321.884
+1.213
0.38%
jan 1, 1999
324.319
+2.435
0.76%
jan 1, 2000
326.754
+2.435
0.75%
jan 1, 2001
329.19
+2.436
0.75%
jan 1, 2002
331.625
+2.435
0.74%
jan 1, 2003
334.06
+2.435
0.73%
jan 1, 2004
333.159
-0.901
-0.27%
jan 1, 2005
332.257
-0.902
-0.27%
jan 1, 2006
331.356
-0.901
-0.27%
jan 1, 2007
330.455
-0.901
-0.27%
jan 1, 2008
329.554
-0.901
-0.27%
jan 1, 2009
324.51
-5.044
-1.53%
jan 1, 2010
319.465
-5.045
-1.55%
jan 1, 2011
314.421
-5.044
-1.58%
jan 1, 2012
309.377
-5.044
-1.6%
jan 1, 2013
304.332
-5.045
-1.63%
jan 1, 2014
301.989
-2.343
-0.77%
jan 1, 2015
299.646
-2.343
-0.78%
Ranking of countries by current statistics by years


Comments: