29
/
en
AIzaSyAYiBZKx7MnpbEhh9jyipgxe19OcubqV5w
April 1, 2024
181387
Lithuania
LTU
true
2
1
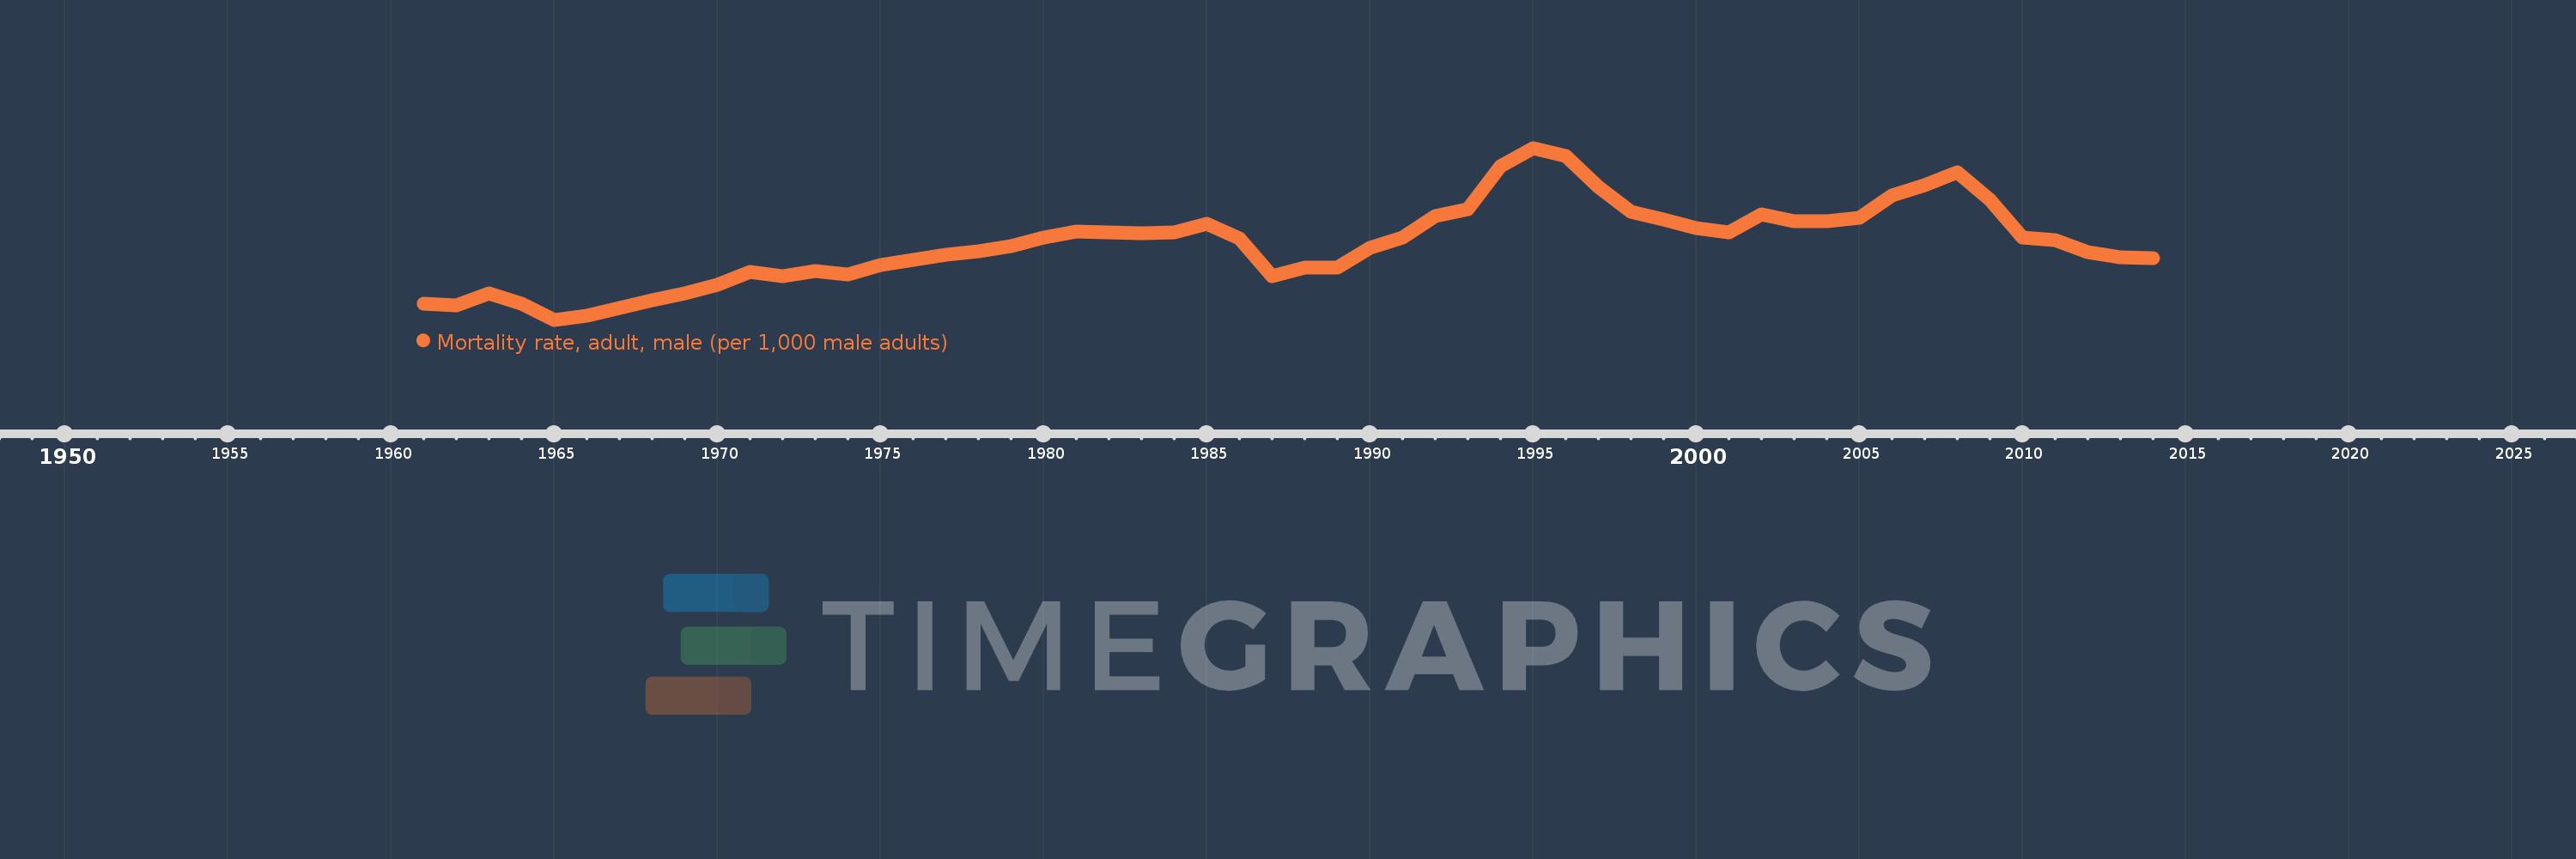
Mortality rate, adult, male (per 1,000 male adults)
2014,2013,2012,2011,2010,2009,2008,2007,2006,2005,2004,2003,2002,2001,2000,1999,1998,1997,1996,1995,1994,1993,1992,1991,1990,1989,1988,1987,1986,1985,1984,1983,1982,1981,1980,1979,1978,1977,1976,1975,1974,1973,1972,1971,1970,1969,1968,1967,1966,1965,1964,1963,1962,1961
This statistics in other country:
AfghanistanAlbaniaAlgeriaAngolaAntigua and BarbudaArab WorldArgentinaArmeniaArubaAustraliaAustriaAzerbaijanBahamas, TheBahrainBangladeshBarbadosBelarusBelgiumBelizeBeninBhutanBoliviaBosnia and HerzegovinaBotswanaBrazilBrunei DarussalamBulgariaBurkina FasoBurundiCabo VerdeCambodiaCameroonCanadaCaribbean small statesCentral African RepublicCentral Europe and the BalticsChadChannel IslandsChileChinaColombiaComorosCongo, Dem. Rep.Congo, Rep.Costa RicaCote d'IvoireCroatiaCubaCuracaoCyprusCzech RepublicDenmarkDjiboutiDominicaDominican RepublicEarly-demographic dividendEast Asia & PacificEast Asia & Pacific (excluding high income)East Asia & Pacific (IDA & IBRD countries)EcuadorEgypt, Arab Rep.El SalvadorEquatorial GuineaEritreaEstoniaEthiopiaEuro areaEurope & Central AsiaEurope & Central Asia (excluding high income)Europe & Central Asia (IDA & IBRD countries)European UnionFijiFinlandFragile and conflict affected situationsFranceFrench PolynesiaGabonGambia, TheGeorgiaGermanyGhanaGreeceGreenlandGrenadaGuamGuatemalaGuineaGuinea-BissauGuyanaHaitiHeavily indebted poor countries (HIPC)High incomeHondurasHong Kong SAR, ChinaHungaryIBRD onlyIcelandIDA & IBRD totalIDA blendIDA onlyIDA totalIndiaIndonesiaIran, Islamic Rep.IraqIrelandIsraelItalyJamaicaJapanJordanKazakhstanKenyaKiribatiKorea, Dem. People’s Rep.Korea, Rep.KuwaitKyrgyz RepublicLao PDRLate-demographic dividendLatin America & Caribbean Latin America & Caribbean (excluding high income)Latin America & the Caribbean (IDA & IBRD countries)LatviaLeast developed countries: UN classificationLebanonLesothoLiberiaLibyaLithuaniaLow & middle incomeLow incomeLower middle incomeLuxembourgMacao SAR, ChinaMacedonia, FYRMadagascarMalawiMalaysiaMaldivesMaliMaltaMarshall IslandsMauritaniaMauritiusMexicoMicronesia, Fed. Sts.Middle East & North AfricaMiddle East & North Africa (excluding high income)Middle East & North Africa (IDA & IBRD countries)Middle incomeMoldovaMongoliaMontenegroMoroccoMozambiqueMyanmarNamibiaNepalNetherlandsNew CaledoniaNew ZealandNicaraguaNigerNigeriaNorth AmericaNorwayOECD membersOmanOther small statesPacific island small statesPakistanPanamaPapua New GuineaParaguayPeruPhilippinesPolandPortugalPost-demographic dividendPre-demographic dividendPuerto RicoQatarRomaniaRussian FederationRwandaSamoaSao Tome and PrincipeSaudi ArabiaSenegalSerbiaSeychellesSierra LeoneSingaporeSlovak RepublicSloveniaSmall statesSolomon IslandsSomaliaSouth AfricaSouth AsiaSouth Asia (IDA & IBRD)South SudanSpainSri LankaSt. Kitts and NevisSt. LuciaSt. Vincent and the GrenadinesSub-Saharan Africa Sub-Saharan Africa (excluding high income)Sub-Saharan Africa (IDA & IBRD countries)SudanSurinameSwazilandSwedenSwitzerlandSyrian Arab RepublicTajikistanTanzaniaThailandTimor-LesteTogoTongaTrinidad and TobagoTunisiaTurkeyTurkmenistanUgandaUkraineUnited Arab EmiratesUnited KingdomUnited StatesUpper middle incomeUruguayUzbekistanVanuatuVenezuela, RBVietnamVirgin Islands (U.S.)West Bank and GazaWorldYemen, Rep.ZambiaZimbabwe Timeline:
This timeline shows a graph from 1961 to 2014 of Lithuania. No data until 1960. Number of actual observations by date: 54.
Source name:
World Development Indicators
Source organization:
(1) United Nations Population Division. World Population Prospects. New York, United Nations, Department of Economic and Social Affairs (advanced Excel tables). Available at http://esa.un.org/wpp/unpp/panel_population.htm, (2) University of California, Berkeley, and Max Planck Institute for Demographic Research. Human Mortality Database. [ www.mortality.org or www.humanmortality.de].
Categories, topics:
Health, Gender
Last updated:
apr 23, 2017
Indicators value changes by year
Minimum:
201.37
jan 1, 1965
Maximum:
380.916
jan 1, 1995
At the date of observation
Value
Absolute change
Change from previous value
jan 1, 1961
218.011
+218.011
0.0%
jan 1, 1962
216.104
-1.907
-0.87%
jan 1, 1963
228.491
+12.387
5.73%
jan 1, 1964
217.949
-10.542
-4.61%
jan 1, 1965
201.37
-16.579
-7.61%
jan 1, 1966
206.024
+4.654
2.31%
jan 1, 1967
213.235
+7.211
3.5%
jan 1, 1968
221.829
+8.594
4.03%
jan 1, 1969
228.805
+6.976
3.14%
jan 1, 1970
237.482
+8.677
3.79%
jan 1, 1971
251.243
+13.761
5.79%
jan 1, 1972
246.681
-4.562
-1.82%
jan 1, 1973
251.966
+5.285
2.14%
jan 1, 1974
249.023
-2.943
-1.17%
jan 1, 1975
258.86
+9.837
3.95%
jan 1, 1976
263.987
+5.127
1.98%
jan 1, 1977
269.765
+5.778
2.19%
jan 1, 1978
272.639
+2.874
1.07%
jan 1, 1979
278.442
+5.803
2.13%
jan 1, 1980
287.546
+9.104
3.27%
jan 1, 1981
293.649
+6.103
2.12%
jan 1, 1982
292.59
-1.059
-0.36%
jan 1, 1983
291.439
-1.151
-0.39%
jan 1, 1984
292.453
+1.014
0.35%
jan 1, 1985
301.747
+9.294
3.18%
jan 1, 1986
286.089
-15.658
-5.19%
jan 1, 1987
247.253
-38.836
-13.57%
jan 1, 1988
256.015
+8.762
3.54%
jan 1, 1989
255.863
-0.152
-0.06%
jan 1, 1990
276.637
+20.774
8.12%
jan 1, 1991
287.682
+11.045
3.99%
jan 1, 1992
309.827
+22.145
7.7%
jan 1, 1993
317.026
+7.199
2.32%
jan 1, 1994
361.372
+44.346
13.99%
jan 1, 1995
380.916
+19.544
5.41%
jan 1, 1996
372.386
-8.53
-2.24%
jan 1, 1997
340.618
-31.768
-8.53%
jan 1, 1998
314.204
-26.414
-7.75%
jan 1, 1999
306.329
-7.875
-2.51%
jan 1, 2000
296.826
-9.503
-3.1%
jan 1, 2001
292.998
-3.828
-1.29%
jan 1, 2002
311.156
+18.158
6.2%
jan 1, 2003
304.481
-6.675
-2.15%
jan 1, 2004
304.555
+0.074
0.02%
jan 1, 2005
307.692
+3.137
1.03%
jan 1, 2006
331.582
+23.89
7.76%
jan 1, 2007
342.187
+10.605
3.2%
jan 1, 2008
355.748
+13.561
3.96%
jan 1, 2009
326.613
-29.135
-8.19%
jan 1, 2010
286.961
-39.652
-12.14%
jan 1, 2011
284.36
-2.601
-0.91%
jan 1, 2012
272.437
-11.923
-4.19%
jan 1, 2013
266.528
-5.909
-2.17%
jan 1, 2014
266.025
-0.503
-0.19%
Ranking of countries by current statistics by years


Comments: