29
/
en
AIzaSyAYiBZKx7MnpbEhh9jyipgxe19OcubqV5w
April 1, 2024
257585
Switzerland
CHE
true
2
1
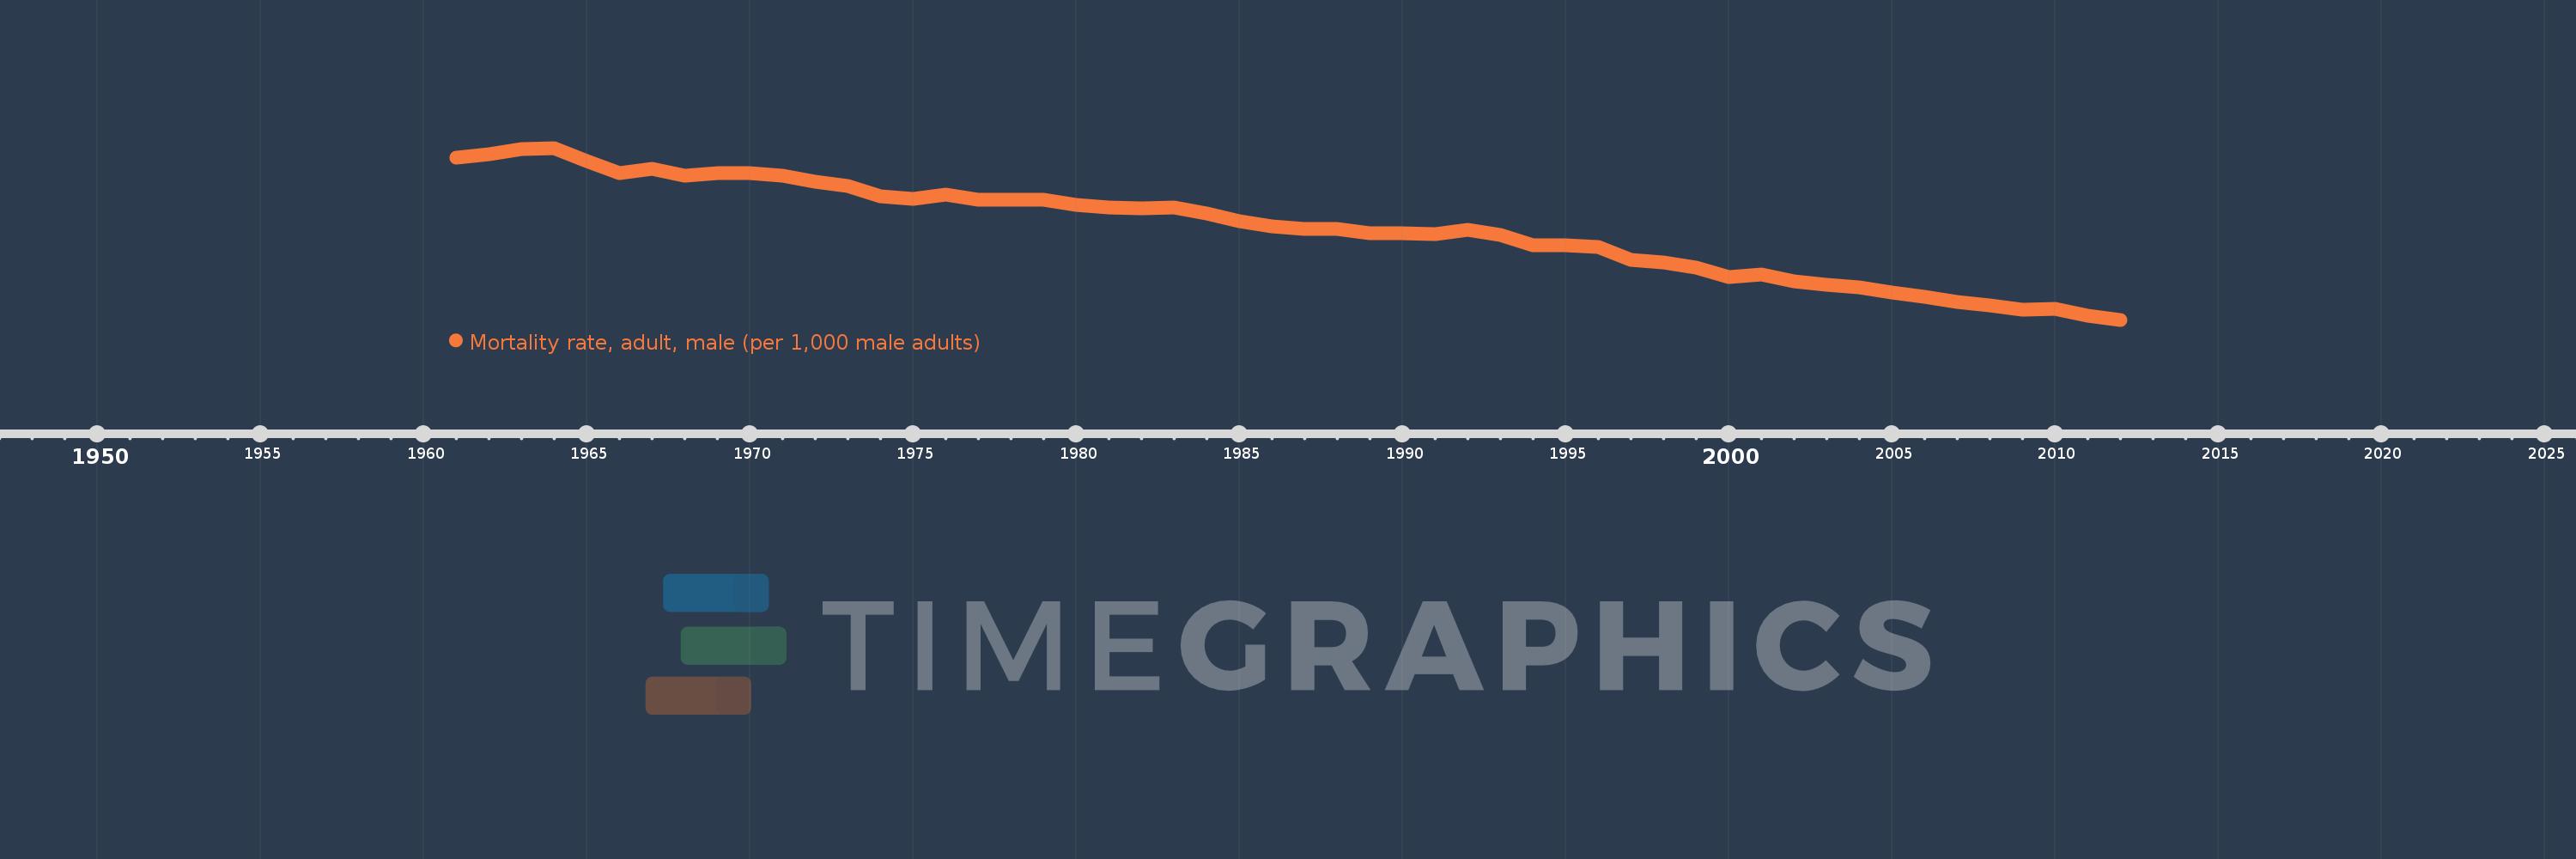
Mortality rate, adult, male (per 1,000 male adults)
2012,2011,2010,2009,2008,2007,2006,2005,2004,2003,2002,2001,2000,1999,1998,1997,1996,1995,1994,1993,1992,1991,1990,1989,1988,1987,1986,1985,1984,1983,1982,1981,1980,1979,1978,1977,1976,1975,1974,1973,1972,1971,1970,1969,1968,1967,1966,1965,1964,1963,1962,1961
This statistics in other country:
AfghanistanAlbaniaAlgeriaAngolaAntigua and BarbudaArab WorldArgentinaArmeniaArubaAustraliaAustriaAzerbaijanBahamas, TheBahrainBangladeshBarbadosBelarusBelgiumBelizeBeninBhutanBoliviaBosnia and HerzegovinaBotswanaBrazilBrunei DarussalamBulgariaBurkina FasoBurundiCabo VerdeCambodiaCameroonCanadaCaribbean small statesCentral African RepublicCentral Europe and the BalticsChadChannel IslandsChileChinaColombiaComorosCongo, Dem. Rep.Congo, Rep.Costa RicaCote d'IvoireCroatiaCubaCuracaoCyprusCzech RepublicDenmarkDjiboutiDominicaDominican RepublicEarly-demographic dividendEast Asia & PacificEast Asia & Pacific (excluding high income)East Asia & Pacific (IDA & IBRD countries)EcuadorEgypt, Arab Rep.El SalvadorEquatorial GuineaEritreaEstoniaEthiopiaEuro areaEurope & Central AsiaEurope & Central Asia (excluding high income)Europe & Central Asia (IDA & IBRD countries)European UnionFijiFinlandFragile and conflict affected situationsFranceFrench PolynesiaGabonGambia, TheGeorgiaGermanyGhanaGreeceGreenlandGrenadaGuamGuatemalaGuineaGuinea-BissauGuyanaHaitiHeavily indebted poor countries (HIPC)High incomeHondurasHong Kong SAR, ChinaHungaryIBRD onlyIcelandIDA & IBRD totalIDA blendIDA onlyIDA totalIndiaIndonesiaIran, Islamic Rep.IraqIrelandIsraelItalyJamaicaJapanJordanKazakhstanKenyaKiribatiKorea, Dem. People’s Rep.Korea, Rep.KuwaitKyrgyz RepublicLao PDRLate-demographic dividendLatin America & Caribbean Latin America & Caribbean (excluding high income)Latin America & the Caribbean (IDA & IBRD countries)LatviaLeast developed countries: UN classificationLebanonLesothoLiberiaLibyaLithuaniaLow & middle incomeLow incomeLower middle incomeLuxembourgMacao SAR, ChinaMacedonia, FYRMadagascarMalawiMalaysiaMaldivesMaliMaltaMarshall IslandsMauritaniaMauritiusMexicoMicronesia, Fed. Sts.Middle East & North AfricaMiddle East & North Africa (excluding high income)Middle East & North Africa (IDA & IBRD countries)Middle incomeMoldovaMongoliaMontenegroMoroccoMozambiqueMyanmarNamibiaNepalNetherlandsNew CaledoniaNew ZealandNicaraguaNigerNigeriaNorth AmericaNorwayOECD membersOmanOther small statesPacific island small statesPakistanPanamaPapua New GuineaParaguayPeruPhilippinesPolandPortugalPost-demographic dividendPre-demographic dividendPuerto RicoQatarRomaniaRussian FederationRwandaSamoaSao Tome and PrincipeSaudi ArabiaSenegalSerbiaSeychellesSierra LeoneSingaporeSlovak RepublicSloveniaSmall statesSolomon IslandsSomaliaSouth AfricaSouth AsiaSouth Asia (IDA & IBRD)South SudanSpainSri LankaSt. Kitts and NevisSt. LuciaSt. Vincent and the GrenadinesSub-Saharan Africa Sub-Saharan Africa (excluding high income)Sub-Saharan Africa (IDA & IBRD countries)SudanSurinameSwazilandSwedenSwitzerlandSyrian Arab RepublicTajikistanTanzaniaThailandTimor-LesteTogoTongaTrinidad and TobagoTunisiaTurkeyTurkmenistanUgandaUkraineUnited Arab EmiratesUnited KingdomUnited StatesUpper middle incomeUruguayUzbekistanVanuatuVenezuela, RBVietnamVirgin Islands (U.S.)West Bank and GazaWorldYemen, Rep.ZambiaZimbabwe Timeline:
This timeline shows a graph from 1961 to 2012 of Switzerland. No data until 1960. Number of actual observations by date: 52.
Source name:
World Development Indicators
Source organization:
(1) United Nations Population Division. World Population Prospects. New York, United Nations, Department of Economic and Social Affairs (advanced Excel tables). Available at http://esa.un.org/wpp/unpp/panel_population.htm, (2) University of California, Berkeley, and Max Planck Institute for Demographic Research. Human Mortality Database. [ www.mortality.org or www.humanmortality.de].
Categories, topics:
Health, Gender
Last updated:
apr 23, 2017
Indicators value changes by year
Minimum:
68.462
jan 1, 2012
Maximum:
185.156
jan 1, 1964
At the date of observation
Value
Absolute change
Change from previous value
jan 1, 1961
178.541
+178.541
0.0%
jan 1, 1962
180.71
+2.169
1.21%
jan 1, 1963
184.109
+3.399
1.88%
jan 1, 1964
185.156
+1.047
0.57%
jan 1, 1965
176.231
-8.925
-4.82%
jan 1, 1966
168.052
-8.179
-4.64%
jan 1, 1967
171.055
+3.003
1.79%
jan 1, 1968
166.476
-4.579
-2.68%
jan 1, 1969
167.929
+1.453
0.87%
jan 1, 1970
168.343
+0.414
0.25%
jan 1, 1971
166.294
-2.049
-1.22%
jan 1, 1972
162.011
-4.283
-2.58%
jan 1, 1973
159.283
-2.728
-1.68%
jan 1, 1974
152.144
-7.139
-4.48%
jan 1, 1975
150.469
-1.675
-1.1%
jan 1, 1976
153.598
+3.129
2.08%
jan 1, 1977
149.911
-3.687
-2.4%
jan 1, 1978
149.943
+0.032
0.02%
jan 1, 1979
149.744
-0.199
-0.13%
jan 1, 1980
146.73
-3.014
-2.01%
jan 1, 1981
144.903
-1.827
-1.25%
jan 1, 1982
143.998
-0.905
-0.62%
jan 1, 1983
144.593
+0.595
0.41%
jan 1, 1984
140.489
-4.104
-2.84%
jan 1, 1985
135.582
-4.907
-3.49%
jan 1, 1986
132.053
-3.529
-2.6%
jan 1, 1987
130.017
-2.036
-1.54%
jan 1, 1988
130.331
+0.314
0.24%
jan 1, 1989
127.245
-3.086
-2.37%
jan 1, 1990
127.467
+0.222
0.17%
jan 1, 1991
126.578
-0.889
-0.7%
jan 1, 1992
129.772
+3.194
2.52%
jan 1, 1993
126.065
-3.707
-2.86%
jan 1, 1994
119.258
-6.807
-5.4%
jan 1, 1995
118.927
-0.331
-0.28%
jan 1, 1996
117.641
-1.286
-1.08%
jan 1, 1997
108.849
-8.792
-7.47%
jan 1, 1998
107.096
-1.753
-1.61%
jan 1, 1999
104.051
-3.045
-2.84%
jan 1, 2000
97.263
-6.788
-6.52%
jan 1, 2001
99.349
+2.086
2.14%
jan 1, 2002
94.508
-4.841
-4.87%
jan 1, 2003
92.024
-2.484
-2.63%
jan 1, 2004
90.369
-1.655
-1.8%
jan 1, 2005
87.127
-3.242
-3.59%
jan 1, 2006
83.978
-3.149
-3.61%
jan 1, 2007
80.433
-3.545
-4.22%
jan 1, 2008
78.37
-2.063
-2.56%
jan 1, 2009
75.404
-2.966
-3.78%
jan 1, 2010
75.978
+0.574
0.76%
jan 1, 2011
71.01
-4.968
-6.54%
jan 1, 2012
68.462
-2.548
-3.59%
Ranking of countries by current statistics by years


Comments: