29
/
en
AIzaSyAYiBZKx7MnpbEhh9jyipgxe19OcubqV5w
April 1, 2024
272569
Uganda
UGA
true
2
1
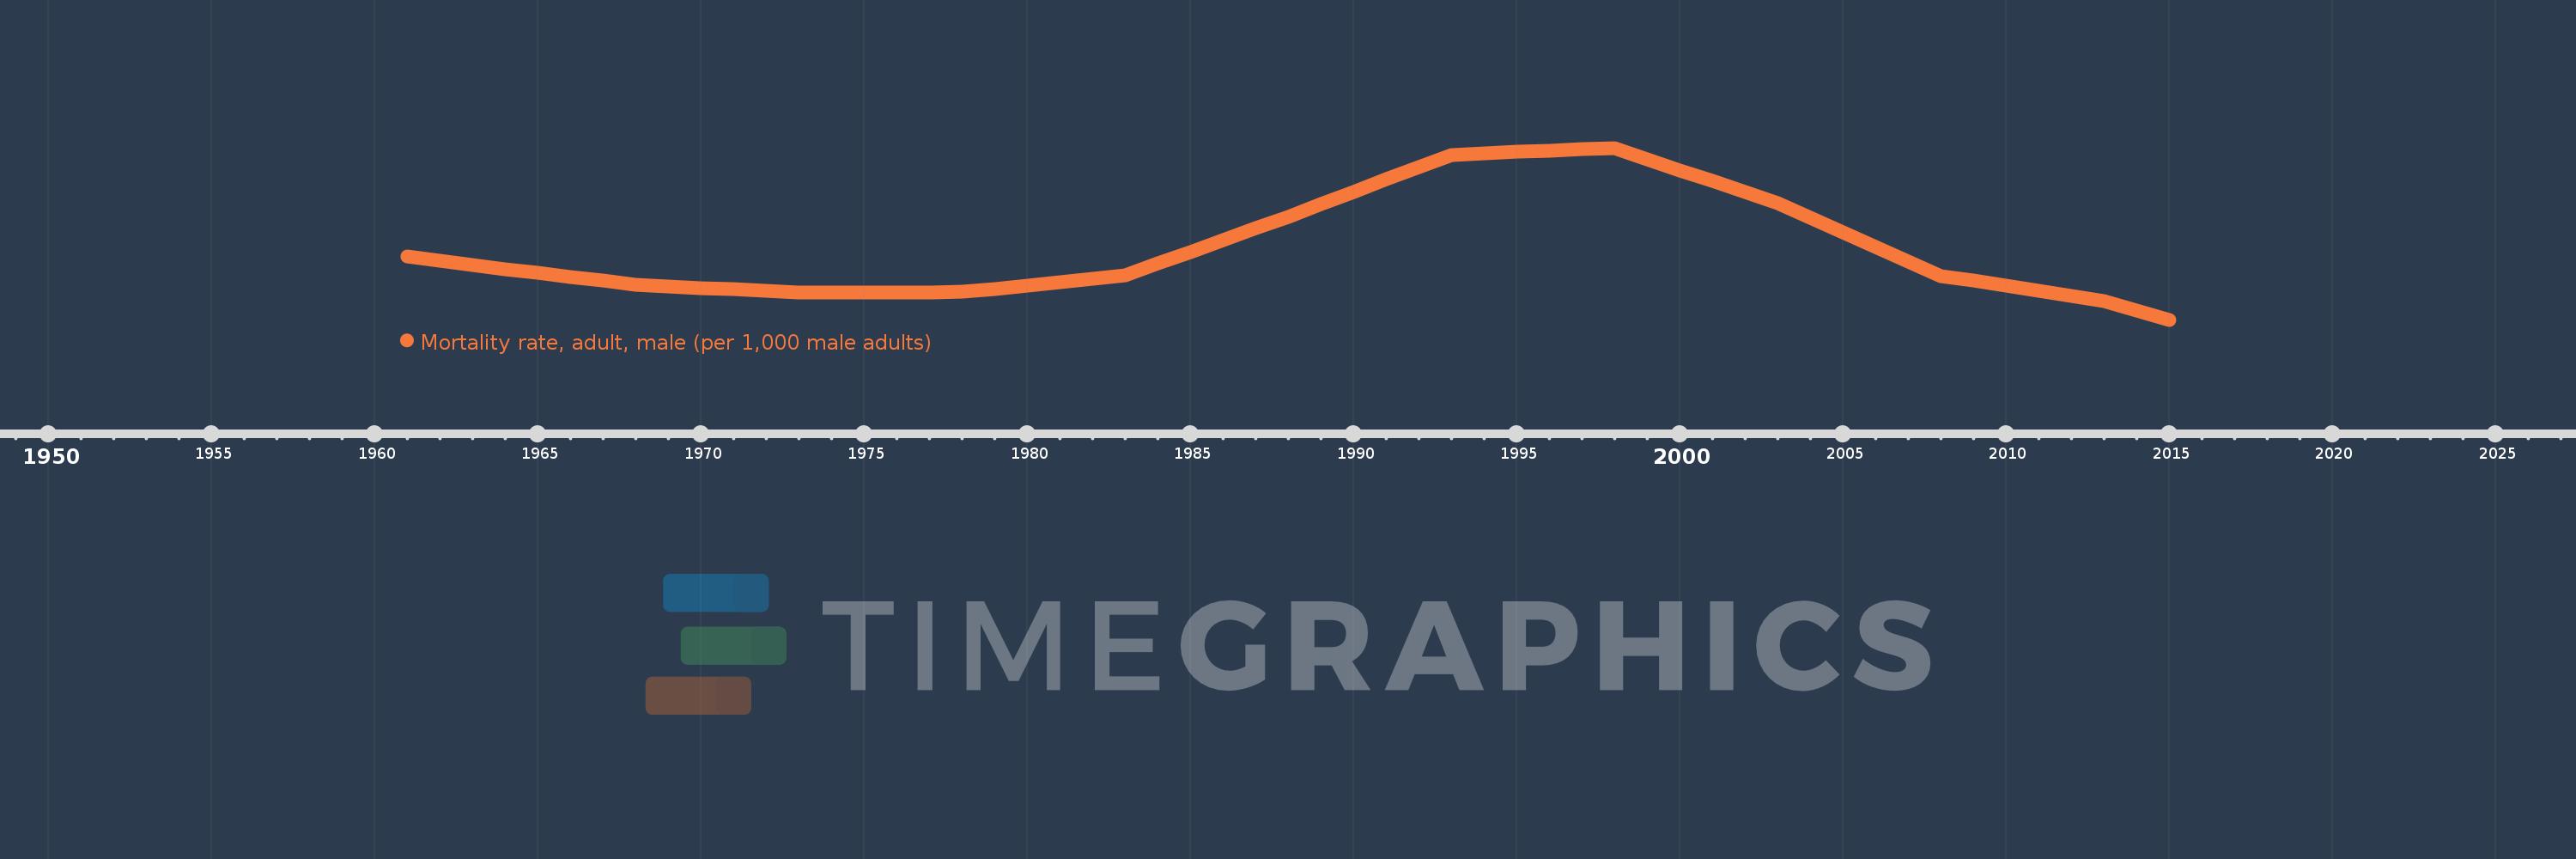
Mortality rate, adult, male (per 1,000 male adults)
2015,2014,2013,2012,2011,2010,2009,2008,2007,2006,2005,2004,2003,2002,2001,2000,1999,1998,1997,1996,1995,1994,1993,1992,1991,1990,1989,1988,1987,1986,1985,1984,1983,1982,1981,1980,1979,1978,1977,1976,1975,1974,1973,1972,1971,1970,1969,1968,1967,1966,1965,1964,1963,1962,1961
This statistics in other country:
AfghanistanAlbaniaAlgeriaAngolaAntigua and BarbudaArab WorldArgentinaArmeniaArubaAustraliaAustriaAzerbaijanBahamas, TheBahrainBangladeshBarbadosBelarusBelgiumBelizeBeninBhutanBoliviaBosnia and HerzegovinaBotswanaBrazilBrunei DarussalamBulgariaBurkina FasoBurundiCabo VerdeCambodiaCameroonCanadaCaribbean small statesCentral African RepublicCentral Europe and the BalticsChadChannel IslandsChileChinaColombiaComorosCongo, Dem. Rep.Congo, Rep.Costa RicaCote d'IvoireCroatiaCubaCuracaoCyprusCzech RepublicDenmarkDjiboutiDominicaDominican RepublicEarly-demographic dividendEast Asia & PacificEast Asia & Pacific (excluding high income)East Asia & Pacific (IDA & IBRD countries)EcuadorEgypt, Arab Rep.El SalvadorEquatorial GuineaEritreaEstoniaEthiopiaEuro areaEurope & Central AsiaEurope & Central Asia (excluding high income)Europe & Central Asia (IDA & IBRD countries)European UnionFijiFinlandFragile and conflict affected situationsFranceFrench PolynesiaGabonGambia, TheGeorgiaGermanyGhanaGreeceGreenlandGrenadaGuamGuatemalaGuineaGuinea-BissauGuyanaHaitiHeavily indebted poor countries (HIPC)High incomeHondurasHong Kong SAR, ChinaHungaryIBRD onlyIcelandIDA & IBRD totalIDA blendIDA onlyIDA totalIndiaIndonesiaIran, Islamic Rep.IraqIrelandIsraelItalyJamaicaJapanJordanKazakhstanKenyaKiribatiKorea, Dem. People’s Rep.Korea, Rep.KuwaitKyrgyz RepublicLao PDRLate-demographic dividendLatin America & Caribbean Latin America & Caribbean (excluding high income)Latin America & the Caribbean (IDA & IBRD countries)LatviaLeast developed countries: UN classificationLebanonLesothoLiberiaLibyaLithuaniaLow & middle incomeLow incomeLower middle incomeLuxembourgMacao SAR, ChinaMacedonia, FYRMadagascarMalawiMalaysiaMaldivesMaliMaltaMarshall IslandsMauritaniaMauritiusMexicoMicronesia, Fed. Sts.Middle East & North AfricaMiddle East & North Africa (excluding high income)Middle East & North Africa (IDA & IBRD countries)Middle incomeMoldovaMongoliaMontenegroMoroccoMozambiqueMyanmarNamibiaNepalNetherlandsNew CaledoniaNew ZealandNicaraguaNigerNigeriaNorth AmericaNorwayOECD membersOmanOther small statesPacific island small statesPakistanPanamaPapua New GuineaParaguayPeruPhilippinesPolandPortugalPost-demographic dividendPre-demographic dividendPuerto RicoQatarRomaniaRussian FederationRwandaSamoaSao Tome and PrincipeSaudi ArabiaSenegalSerbiaSeychellesSierra LeoneSingaporeSlovak RepublicSloveniaSmall statesSolomon IslandsSomaliaSouth AfricaSouth AsiaSouth Asia (IDA & IBRD)South SudanSpainSri LankaSt. Kitts and NevisSt. LuciaSt. Vincent and the GrenadinesSub-Saharan Africa Sub-Saharan Africa (excluding high income)Sub-Saharan Africa (IDA & IBRD countries)SudanSurinameSwazilandSwedenSwitzerlandSyrian Arab RepublicTajikistanTanzaniaThailandTimor-LesteTogoTongaTrinidad and TobagoTunisiaTurkeyTurkmenistanUgandaUkraineUnited Arab EmiratesUnited KingdomUnited StatesUpper middle incomeUruguayUzbekistanVanuatuVenezuela, RBVietnamVirgin Islands (U.S.)West Bank and GazaWorldYemen, Rep.ZambiaZimbabwe Timeline:
This timeline shows a graph from 1961 to 2015 of Uganda. No data until 1960. Number of actual observations by date: 55.
Source name:
World Development Indicators
Source organization:
(1) United Nations Population Division. World Population Prospects. New York, United Nations, Department of Economic and Social Affairs (advanced Excel tables). Available at http://esa.un.org/wpp/unpp/panel_population.htm, (2) University of California, Berkeley, and Max Planck Institute for Demographic Research. Human Mortality Database. [ www.mortality.org or www.humanmortality.de].
Categories, topics:
Health, Gender
Last updated:
apr 23, 2017
Indicators value changes by year
Minimum:
346.127
jan 1, 2015
Maximum:
591.265
jan 1, 1998
At the date of observation
Value
Absolute change
Change from previous value
jan 1, 1961
436.584
+436.584
0.0%
jan 1, 1962
430.374
-6.21
-1.42%
jan 1, 1963
424.163
-6.211
-1.44%
jan 1, 1964
418.546
-5.617
-1.32%
jan 1, 1965
412.928
-5.618
-1.34%
jan 1, 1966
407.311
-5.617
-1.36%
jan 1, 1967
401.694
-5.617
-1.38%
jan 1, 1968
396.076
-5.618
-1.4%
jan 1, 1969
393.818
-2.258
-0.57%
jan 1, 1970
391.56
-2.258
-0.57%
jan 1, 1971
389.302
-2.258
-0.58%
jan 1, 1972
387.044
-2.258
-0.58%
jan 1, 1973
384.786
-2.258
-0.58%
jan 1, 1974
384.969
+0.183
0.05%
jan 1, 1975
385.152
+0.183
0.05%
jan 1, 1976
385.334
+0.182
0.05%
jan 1, 1977
385.517
+0.183
0.05%
jan 1, 1978
385.7
+0.183
0.05%
jan 1, 1979
390.487
+4.787
1.24%
jan 1, 1980
395.274
+4.787
1.23%
jan 1, 1981
400.062
+4.788
1.21%
jan 1, 1982
404.849
+4.787
1.2%
jan 1, 1983
409.636
+4.787
1.18%
jan 1, 1984
426.359
+16.723
4.08%
jan 1, 1985
443.082
+16.723
3.92%
jan 1, 1986
459.805
+16.723
3.77%
jan 1, 1987
476.527
+16.722
3.64%
jan 1, 1988
493.25
+16.723
3.51%
jan 1, 1989
510.9
+17.65
3.58%
jan 1, 1990
528.551
+17.651
3.45%
jan 1, 1991
546.201
+17.65
3.34%
jan 1, 1992
563.851
+17.65
3.23%
jan 1, 1993
581.502
+17.651
3.13%
jan 1, 1994
583.454
+1.952
0.34%
jan 1, 1995
585.407
+1.953
0.33%
jan 1, 1996
587.36
+1.953
0.33%
jan 1, 1997
589.312
+1.952
0.33%
jan 1, 1998
591.265
+1.953
0.33%
jan 1, 1999
575.438
-15.827
-2.68%
jan 1, 2000
559.61
-15.828
-2.75%
jan 1, 2001
543.783
-15.827
-2.83%
jan 1, 2002
527.955
-15.828
-2.91%
jan 1, 2003
512.128
-15.827
-3.0%
jan 1, 2004
491.458
-20.67
-4.04%
jan 1, 2005
470.788
-20.67
-4.21%
jan 1, 2006
450.118
-20.67
-4.39%
jan 1, 2007
429.448
-20.67
-4.59%
jan 1, 2008
408.778
-20.67
-4.81%
jan 1, 2009
401.558
-7.22
-1.77%
jan 1, 2010
394.338
-7.22
-1.8%
jan 1, 2011
387.118
-7.22
-1.83%
jan 1, 2012
379.898
-7.22
-1.87%
jan 1, 2013
372.678
-7.22
-1.9%
jan 1, 2014
359.402
-13.276
-3.56%
jan 1, 2015
346.127
-13.275
-3.69%
Ranking of countries by current statistics by years


Comments: