29
/
en
AIzaSyAYiBZKx7MnpbEhh9jyipgxe19OcubqV5w
April 1, 2024
191675
Malta
MLT
true
2
1
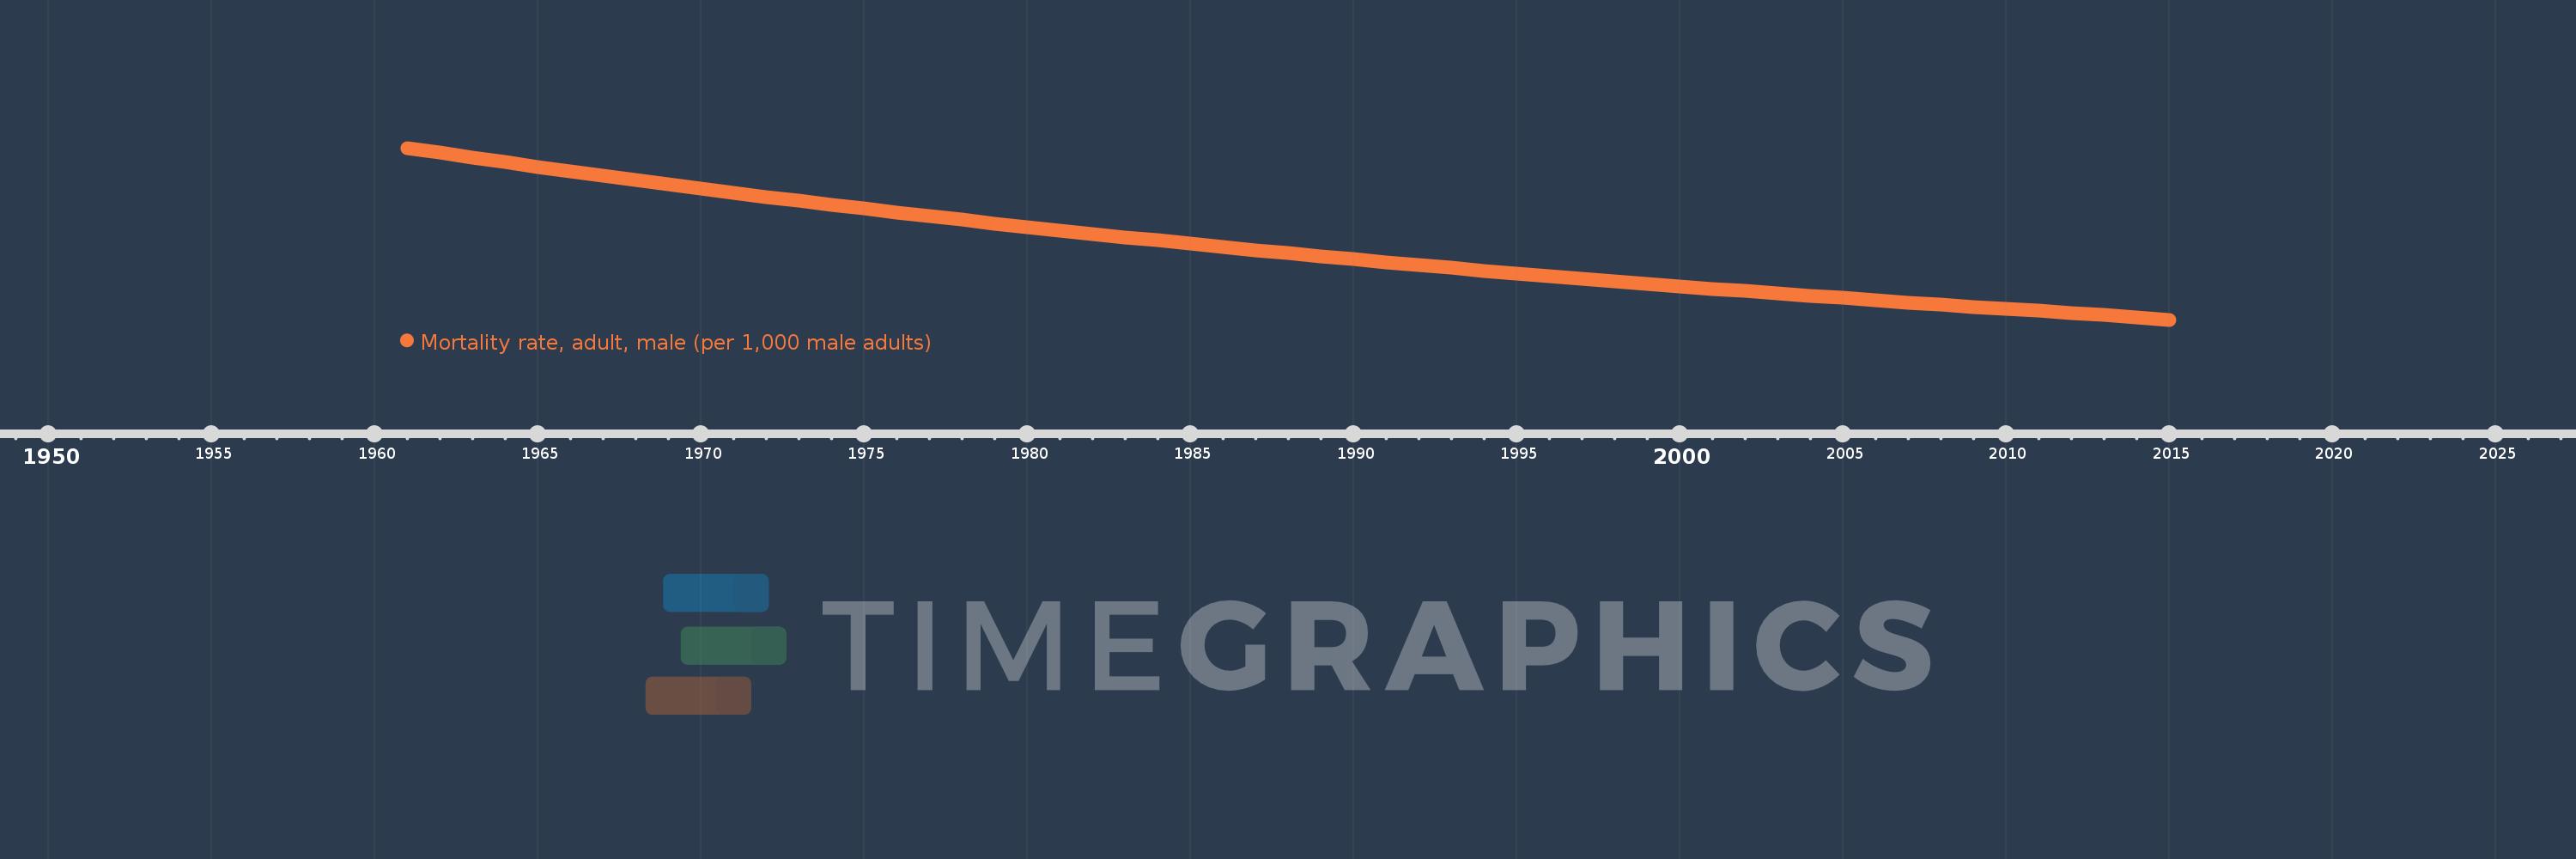
Mortality rate, adult, male (per 1,000 male adults)
2015,2014,2013,2012,2011,2010,2009,2008,2007,2006,2005,2004,2003,2002,2001,2000,1999,1998,1997,1996,1995,1994,1993,1992,1991,1990,1989,1988,1987,1986,1985,1984,1983,1982,1981,1980,1979,1978,1977,1976,1975,1974,1973,1972,1971,1970,1969,1968,1967,1966,1965,1964,1963,1962,1961
This statistics in other country:
AfghanistanAlbaniaAlgeriaAngolaAntigua and BarbudaArab WorldArgentinaArmeniaArubaAustraliaAustriaAzerbaijanBahamas, TheBahrainBangladeshBarbadosBelarusBelgiumBelizeBeninBhutanBoliviaBosnia and HerzegovinaBotswanaBrazilBrunei DarussalamBulgariaBurkina FasoBurundiCabo VerdeCambodiaCameroonCanadaCaribbean small statesCentral African RepublicCentral Europe and the BalticsChadChannel IslandsChileChinaColombiaComorosCongo, Dem. Rep.Congo, Rep.Costa RicaCote d'IvoireCroatiaCubaCuracaoCyprusCzech RepublicDenmarkDjiboutiDominicaDominican RepublicEarly-demographic dividendEast Asia & PacificEast Asia & Pacific (excluding high income)East Asia & Pacific (IDA & IBRD countries)EcuadorEgypt, Arab Rep.El SalvadorEquatorial GuineaEritreaEstoniaEthiopiaEuro areaEurope & Central AsiaEurope & Central Asia (excluding high income)Europe & Central Asia (IDA & IBRD countries)European UnionFijiFinlandFragile and conflict affected situationsFranceFrench PolynesiaGabonGambia, TheGeorgiaGermanyGhanaGreeceGreenlandGrenadaGuamGuatemalaGuineaGuinea-BissauGuyanaHaitiHeavily indebted poor countries (HIPC)High incomeHondurasHong Kong SAR, ChinaHungaryIBRD onlyIcelandIDA & IBRD totalIDA blendIDA onlyIDA totalIndiaIndonesiaIran, Islamic Rep.IraqIrelandIsraelItalyJamaicaJapanJordanKazakhstanKenyaKiribatiKorea, Dem. People’s Rep.Korea, Rep.KuwaitKyrgyz RepublicLao PDRLate-demographic dividendLatin America & Caribbean Latin America & Caribbean (excluding high income)Latin America & the Caribbean (IDA & IBRD countries)LatviaLeast developed countries: UN classificationLebanonLesothoLiberiaLibyaLithuaniaLow & middle incomeLow incomeLower middle incomeLuxembourgMacao SAR, ChinaMacedonia, FYRMadagascarMalawiMalaysiaMaldivesMaliMaltaMarshall IslandsMauritaniaMauritiusMexicoMicronesia, Fed. Sts.Middle East & North AfricaMiddle East & North Africa (excluding high income)Middle East & North Africa (IDA & IBRD countries)Middle incomeMoldovaMongoliaMontenegroMoroccoMozambiqueMyanmarNamibiaNepalNetherlandsNew CaledoniaNew ZealandNicaraguaNigerNigeriaNorth AmericaNorwayOECD membersOmanOther small statesPacific island small statesPakistanPanamaPapua New GuineaParaguayPeruPhilippinesPolandPortugalPost-demographic dividendPre-demographic dividendPuerto RicoQatarRomaniaRussian FederationRwandaSamoaSao Tome and PrincipeSaudi ArabiaSenegalSerbiaSeychellesSierra LeoneSingaporeSlovak RepublicSloveniaSmall statesSolomon IslandsSomaliaSouth AfricaSouth AsiaSouth Asia (IDA & IBRD)South SudanSpainSri LankaSt. Kitts and NevisSt. LuciaSt. Vincent and the GrenadinesSub-Saharan Africa Sub-Saharan Africa (excluding high income)Sub-Saharan Africa (IDA & IBRD countries)SudanSurinameSwazilandSwedenSwitzerlandSyrian Arab RepublicTajikistanTanzaniaThailandTimor-LesteTogoTongaTrinidad and TobagoTunisiaTurkeyTurkmenistanUgandaUkraineUnited Arab EmiratesUnited KingdomUnited StatesUpper middle incomeUruguayUzbekistanVanuatuVenezuela, RBVietnamVirgin Islands (U.S.)West Bank and GazaWorldYemen, Rep.ZambiaZimbabwe Timeline:
This timeline shows a graph from 1961 to 2015 of Malta. No data until 1960. Number of actual observations by date: 55.
Source name:
World Development Indicators
Source organization:
(1) United Nations Population Division. World Population Prospects. New York, United Nations, Department of Economic and Social Affairs (advanced Excel tables). Available at http://esa.un.org/wpp/unpp/panel_population.htm, (2) University of California, Berkeley, and Max Planck Institute for Demographic Research. Human Mortality Database. [ www.mortality.org or www.humanmortality.de].
Categories, topics:
Health, Gender
Last updated:
apr 23, 2017
Indicators value changes by year
Minimum:
70.033
jan 1, 2015
Maximum:
183.276
jan 1, 1961
At the date of observation
Value
Absolute change
Change from previous value
jan 1, 1961
183.276
+183.276
0.0%
jan 1, 1962
180.057
-3.219
-1.76%
jan 1, 1963
176.837
-3.22
-1.79%
jan 1, 1964
173.871
-2.966
-1.68%
jan 1, 1965
170.905
-2.966
-1.71%
jan 1, 1966
167.94
-2.965
-1.73%
jan 1, 1967
164.974
-2.966
-1.77%
jan 1, 1968
162.008
-2.966
-1.8%
jan 1, 1969
159.281
-2.727
-1.68%
jan 1, 1970
156.553
-2.728
-1.71%
jan 1, 1971
153.826
-2.727
-1.74%
jan 1, 1972
151.098
-2.728
-1.77%
jan 1, 1973
148.37
-2.728
-1.81%
jan 1, 1974
145.865
-2.505
-1.69%
jan 1, 1975
143.36
-2.505
-1.72%
jan 1, 1976
140.855
-2.505
-1.75%
jan 1, 1977
138.35
-2.505
-1.78%
jan 1, 1978
135.845
-2.505
-1.81%
jan 1, 1979
133.546
-2.299
-1.69%
jan 1, 1980
131.248
-2.298
-1.72%
jan 1, 1981
128.95
-2.298
-1.75%
jan 1, 1982
126.652
-2.298
-1.78%
jan 1, 1983
124.354
-2.298
-1.81%
jan 1, 1984
122.248
-2.106
-1.69%
jan 1, 1985
120.142
-2.106
-1.72%
jan 1, 1986
118.036
-2.106
-1.75%
jan 1, 1987
115.929
-2.107
-1.79%
jan 1, 1988
113.823
-2.106
-1.82%
jan 1, 1989
111.895
-1.928
-1.69%
jan 1, 1990
109.967
-1.928
-1.72%
jan 1, 1991
108.038
-1.929
-1.75%
jan 1, 1992
106.11
-1.928
-1.78%
jan 1, 1993
104.182
-1.928
-1.82%
jan 1, 1994
102.418
-1.764
-1.69%
jan 1, 1995
100.653
-1.765
-1.72%
jan 1, 1996
98.889
-1.764
-1.75%
jan 1, 1997
97.125
-1.764
-1.78%
jan 1, 1998
95.361
-1.764
-1.82%
jan 1, 1999
93.748
-1.613
-1.69%
jan 1, 2000
92.135
-1.613
-1.72%
jan 1, 2001
90.522
-1.613
-1.75%
jan 1, 2002
88.909
-1.613
-1.78%
jan 1, 2003
87.296
-1.613
-1.81%
jan 1, 2004
85.823
-1.473
-1.69%
jan 1, 2005
84.349
-1.474
-1.72%
jan 1, 2006
82.875
-1.474
-1.75%
jan 1, 2007
81.401
-1.474
-1.78%
jan 1, 2008
79.927
-1.474
-1.81%
jan 1, 2009
78.581
-1.346
-1.68%
jan 1, 2010
77.235
-1.346
-1.71%
jan 1, 2011
75.889
-1.346
-1.74%
jan 1, 2012
74.543
-1.346
-1.77%
jan 1, 2013
73.197
-1.346
-1.81%
jan 1, 2014
71.615
-1.582
-2.16%
jan 1, 2015
70.033
-1.582
-2.21%
Ranking of countries by current statistics by years


Comments: