29
/
en
AIzaSyAYiBZKx7MnpbEhh9jyipgxe19OcubqV5w
April 1, 2024
188109
Malaysia
MYS
true
2
1
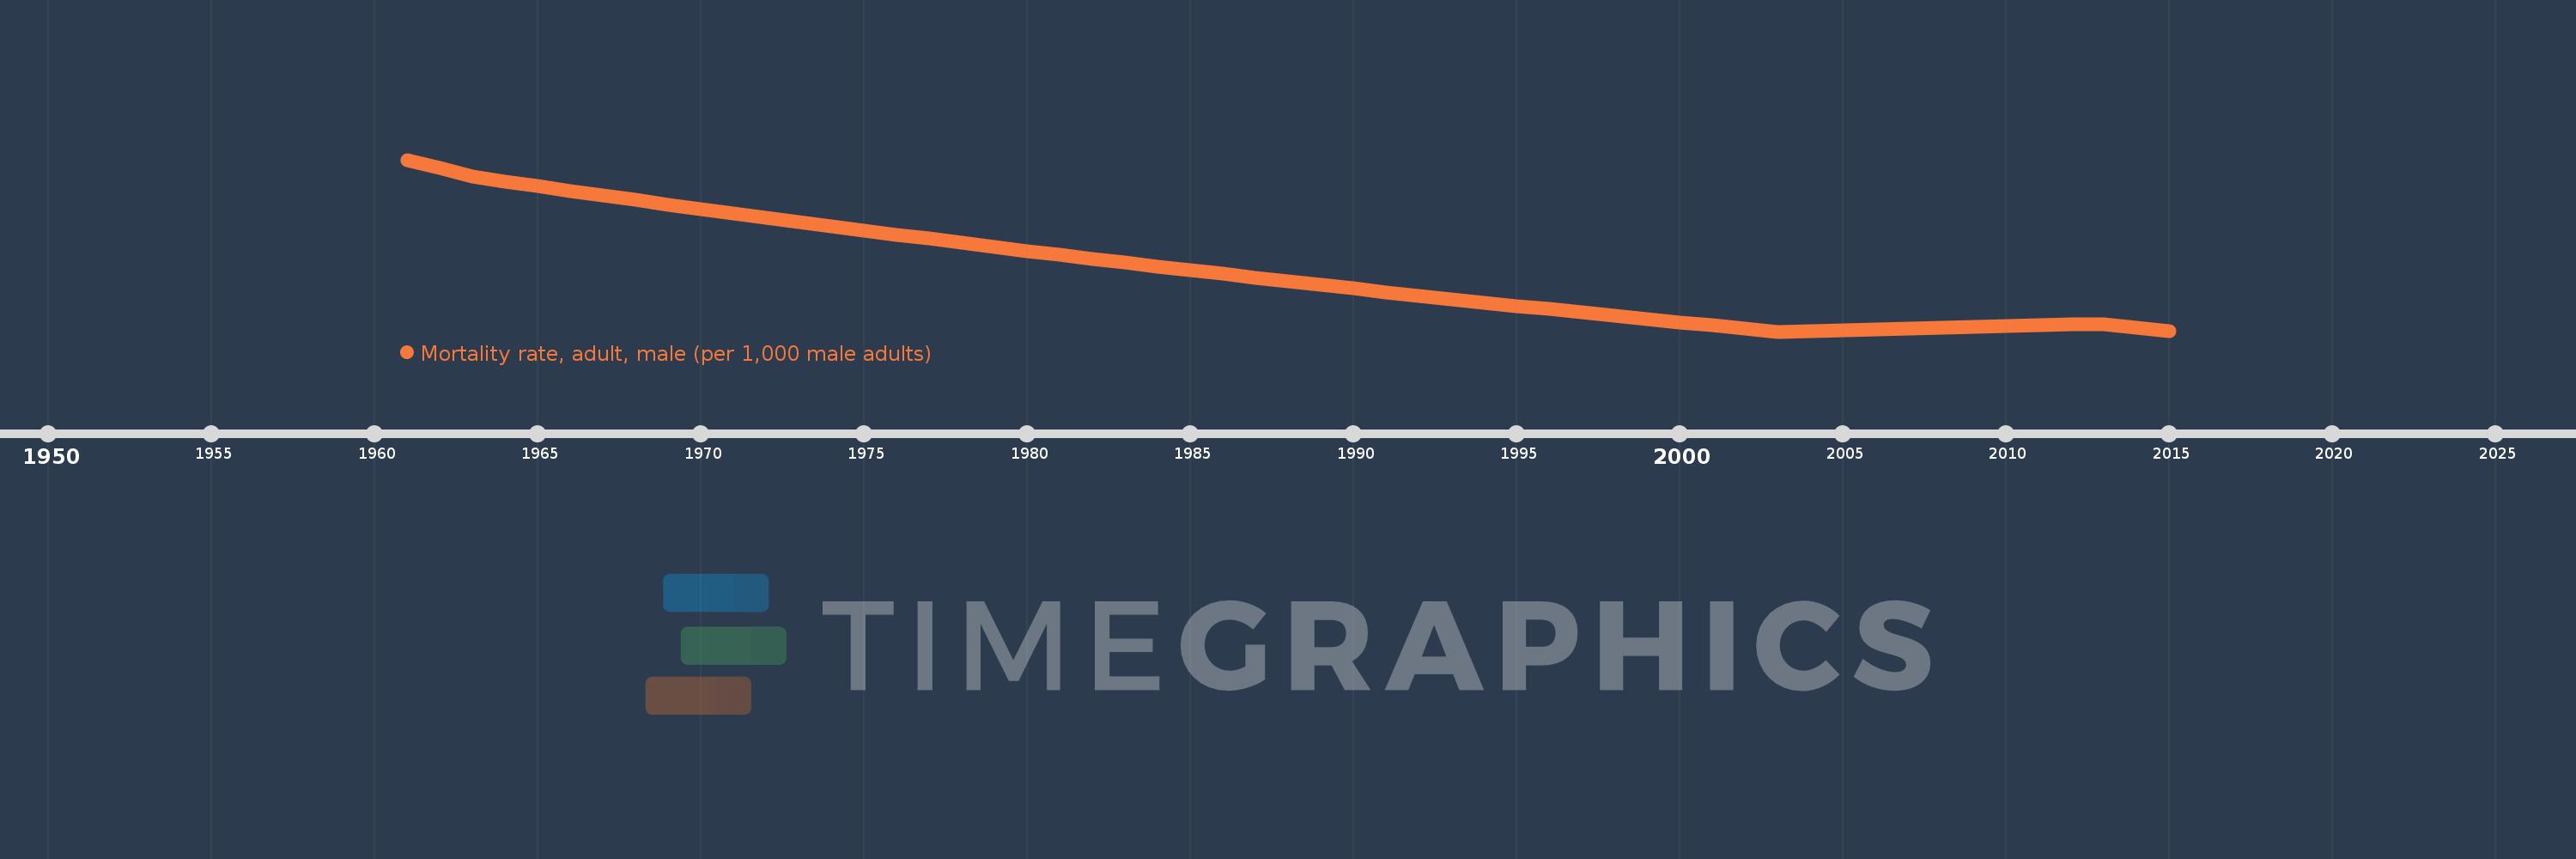
Mortality rate, adult, male (per 1,000 male adults)
2015,2014,2013,2012,2011,2010,2009,2008,2007,2006,2005,2004,2003,2002,2001,2000,1999,1998,1997,1996,1995,1994,1993,1992,1991,1990,1989,1988,1987,1986,1985,1984,1983,1982,1981,1980,1979,1978,1977,1976,1975,1974,1973,1972,1971,1970,1969,1968,1967,1966,1965,1964,1963,1962,1961
This statistics in other country:
AfghanistanAlbaniaAlgeriaAngolaAntigua and BarbudaArab WorldArgentinaArmeniaArubaAustraliaAustriaAzerbaijanBahamas, TheBahrainBangladeshBarbadosBelarusBelgiumBelizeBeninBhutanBoliviaBosnia and HerzegovinaBotswanaBrazilBrunei DarussalamBulgariaBurkina FasoBurundiCabo VerdeCambodiaCameroonCanadaCaribbean small statesCentral African RepublicCentral Europe and the BalticsChadChannel IslandsChileChinaColombiaComorosCongo, Dem. Rep.Congo, Rep.Costa RicaCote d'IvoireCroatiaCubaCuracaoCyprusCzech RepublicDenmarkDjiboutiDominicaDominican RepublicEarly-demographic dividendEast Asia & PacificEast Asia & Pacific (excluding high income)East Asia & Pacific (IDA & IBRD countries)EcuadorEgypt, Arab Rep.El SalvadorEquatorial GuineaEritreaEstoniaEthiopiaEuro areaEurope & Central AsiaEurope & Central Asia (excluding high income)Europe & Central Asia (IDA & IBRD countries)European UnionFijiFinlandFragile and conflict affected situationsFranceFrench PolynesiaGabonGambia, TheGeorgiaGermanyGhanaGreeceGreenlandGrenadaGuamGuatemalaGuineaGuinea-BissauGuyanaHaitiHeavily indebted poor countries (HIPC)High incomeHondurasHong Kong SAR, ChinaHungaryIBRD onlyIcelandIDA & IBRD totalIDA blendIDA onlyIDA totalIndiaIndonesiaIran, Islamic Rep.IraqIrelandIsraelItalyJamaicaJapanJordanKazakhstanKenyaKiribatiKorea, Dem. People’s Rep.Korea, Rep.KuwaitKyrgyz RepublicLao PDRLate-demographic dividendLatin America & Caribbean Latin America & Caribbean (excluding high income)Latin America & the Caribbean (IDA & IBRD countries)LatviaLeast developed countries: UN classificationLebanonLesothoLiberiaLibyaLithuaniaLow & middle incomeLow incomeLower middle incomeLuxembourgMacao SAR, ChinaMacedonia, FYRMadagascarMalawiMalaysiaMaldivesMaliMaltaMarshall IslandsMauritaniaMauritiusMexicoMicronesia, Fed. Sts.Middle East & North AfricaMiddle East & North Africa (excluding high income)Middle East & North Africa (IDA & IBRD countries)Middle incomeMoldovaMongoliaMontenegroMoroccoMozambiqueMyanmarNamibiaNepalNetherlandsNew CaledoniaNew ZealandNicaraguaNigerNigeriaNorth AmericaNorwayOECD membersOmanOther small statesPacific island small statesPakistanPanamaPapua New GuineaParaguayPeruPhilippinesPolandPortugalPost-demographic dividendPre-demographic dividendPuerto RicoQatarRomaniaRussian FederationRwandaSamoaSao Tome and PrincipeSaudi ArabiaSenegalSerbiaSeychellesSierra LeoneSingaporeSlovak RepublicSloveniaSmall statesSolomon IslandsSomaliaSouth AfricaSouth AsiaSouth Asia (IDA & IBRD)South SudanSpainSri LankaSt. Kitts and NevisSt. LuciaSt. Vincent and the GrenadinesSub-Saharan Africa Sub-Saharan Africa (excluding high income)Sub-Saharan Africa (IDA & IBRD countries)SudanSurinameSwazilandSwedenSwitzerlandSyrian Arab RepublicTajikistanTanzaniaThailandTimor-LesteTogoTongaTrinidad and TobagoTunisiaTurkeyTurkmenistanUgandaUkraineUnited Arab EmiratesUnited KingdomUnited StatesUpper middle incomeUruguayUzbekistanVanuatuVenezuela, RBVietnamVirgin Islands (U.S.)West Bank and GazaWorldYemen, Rep.ZambiaZimbabwe Timeline:
This timeline shows a graph from 1961 to 2015 of Malaysia. No data until 1960. Number of actual observations by date: 55.
Source name:
World Development Indicators
Source organization:
(1) United Nations Population Division. World Population Prospects. New York, United Nations, Department of Economic and Social Affairs (advanced Excel tables). Available at http://esa.un.org/wpp/unpp/panel_population.htm, (2) University of California, Berkeley, and Max Planck Institute for Demographic Research. Human Mortality Database. [ www.mortality.org or www.humanmortality.de].
Categories, topics:
Health, Gender
Last updated:
apr 23, 2017
Indicators value changes by year
Minimum:
166.592
jan 1, 2003
Maximum:
286.657
jan 1, 1961
At the date of observation
Value
Absolute change
Change from previous value
jan 1, 1961
286.657
+286.657
0.0%
jan 1, 1962
280.704
-5.953
-2.08%
jan 1, 1963
274.752
-5.952
-2.12%
jan 1, 1964
271.506
-3.246
-1.18%
jan 1, 1965
268.26
-3.246
-1.2%
jan 1, 1966
265.014
-3.246
-1.21%
jan 1, 1967
261.767
-3.247
-1.23%
jan 1, 1968
258.521
-3.246
-1.24%
jan 1, 1969
255.44
-3.081
-1.19%
jan 1, 1970
252.359
-3.081
-1.21%
jan 1, 1971
249.277
-3.082
-1.22%
jan 1, 1972
246.196
-3.081
-1.24%
jan 1, 1973
243.115
-3.081
-1.25%
jan 1, 1974
240.193
-2.922
-1.2%
jan 1, 1975
237.272
-2.921
-1.22%
jan 1, 1976
234.351
-2.921
-1.23%
jan 1, 1977
231.43
-2.921
-1.25%
jan 1, 1978
228.509
-2.921
-1.26%
jan 1, 1979
225.744
-2.765
-1.21%
jan 1, 1980
222.978
-2.766
-1.23%
jan 1, 1981
220.213
-2.765
-1.24%
jan 1, 1982
217.447
-2.766
-1.26%
jan 1, 1983
214.681
-2.766
-1.27%
jan 1, 1984
212.066
-2.615
-1.22%
jan 1, 1985
209.451
-2.615
-1.23%
jan 1, 1986
206.835
-2.616
-1.25%
jan 1, 1987
204.22
-2.615
-1.26%
jan 1, 1988
201.604
-2.616
-1.28%
jan 1, 1989
199.133
-2.471
-1.23%
jan 1, 1990
196.662
-2.471
-1.24%
jan 1, 1991
194.191
-2.471
-1.26%
jan 1, 1992
191.72
-2.471
-1.27%
jan 1, 1993
189.249
-2.471
-1.29%
jan 1, 1994
186.917
-2.332
-1.23%
jan 1, 1995
184.585
-2.332
-1.25%
jan 1, 1996
182.253
-2.332
-1.26%
jan 1, 1997
179.921
-2.332
-1.28%
jan 1, 1998
177.588
-2.333
-1.3%
jan 1, 1999
175.389
-2.199
-1.24%
jan 1, 2000
173.19
-2.199
-1.25%
jan 1, 2001
170.99
-2.2
-1.27%
jan 1, 2002
168.791
-2.199
-1.29%
jan 1, 2003
166.592
-2.199
-1.3%
jan 1, 2004
167.128
+0.536
0.32%
jan 1, 2005
167.665
+0.537
0.32%
jan 1, 2006
168.202
+0.537
0.32%
jan 1, 2007
168.738
+0.536
0.32%
jan 1, 2008
169.275
+0.537
0.32%
jan 1, 2009
169.809
+0.534
0.32%
jan 1, 2010
170.344
+0.535
0.32%
jan 1, 2011
170.879
+0.535
0.31%
jan 1, 2012
171.414
+0.535
0.31%
jan 1, 2013
171.948
+0.534
0.31%
jan 1, 2014
169.332
-2.616
-1.52%
jan 1, 2015
166.716
-2.616
-1.54%
Ranking of countries by current statistics by years


Comments: