29
/
en
AIzaSyAYiBZKx7MnpbEhh9jyipgxe19OcubqV5w
April 1, 2024
106270
China
CHN
true
2
1
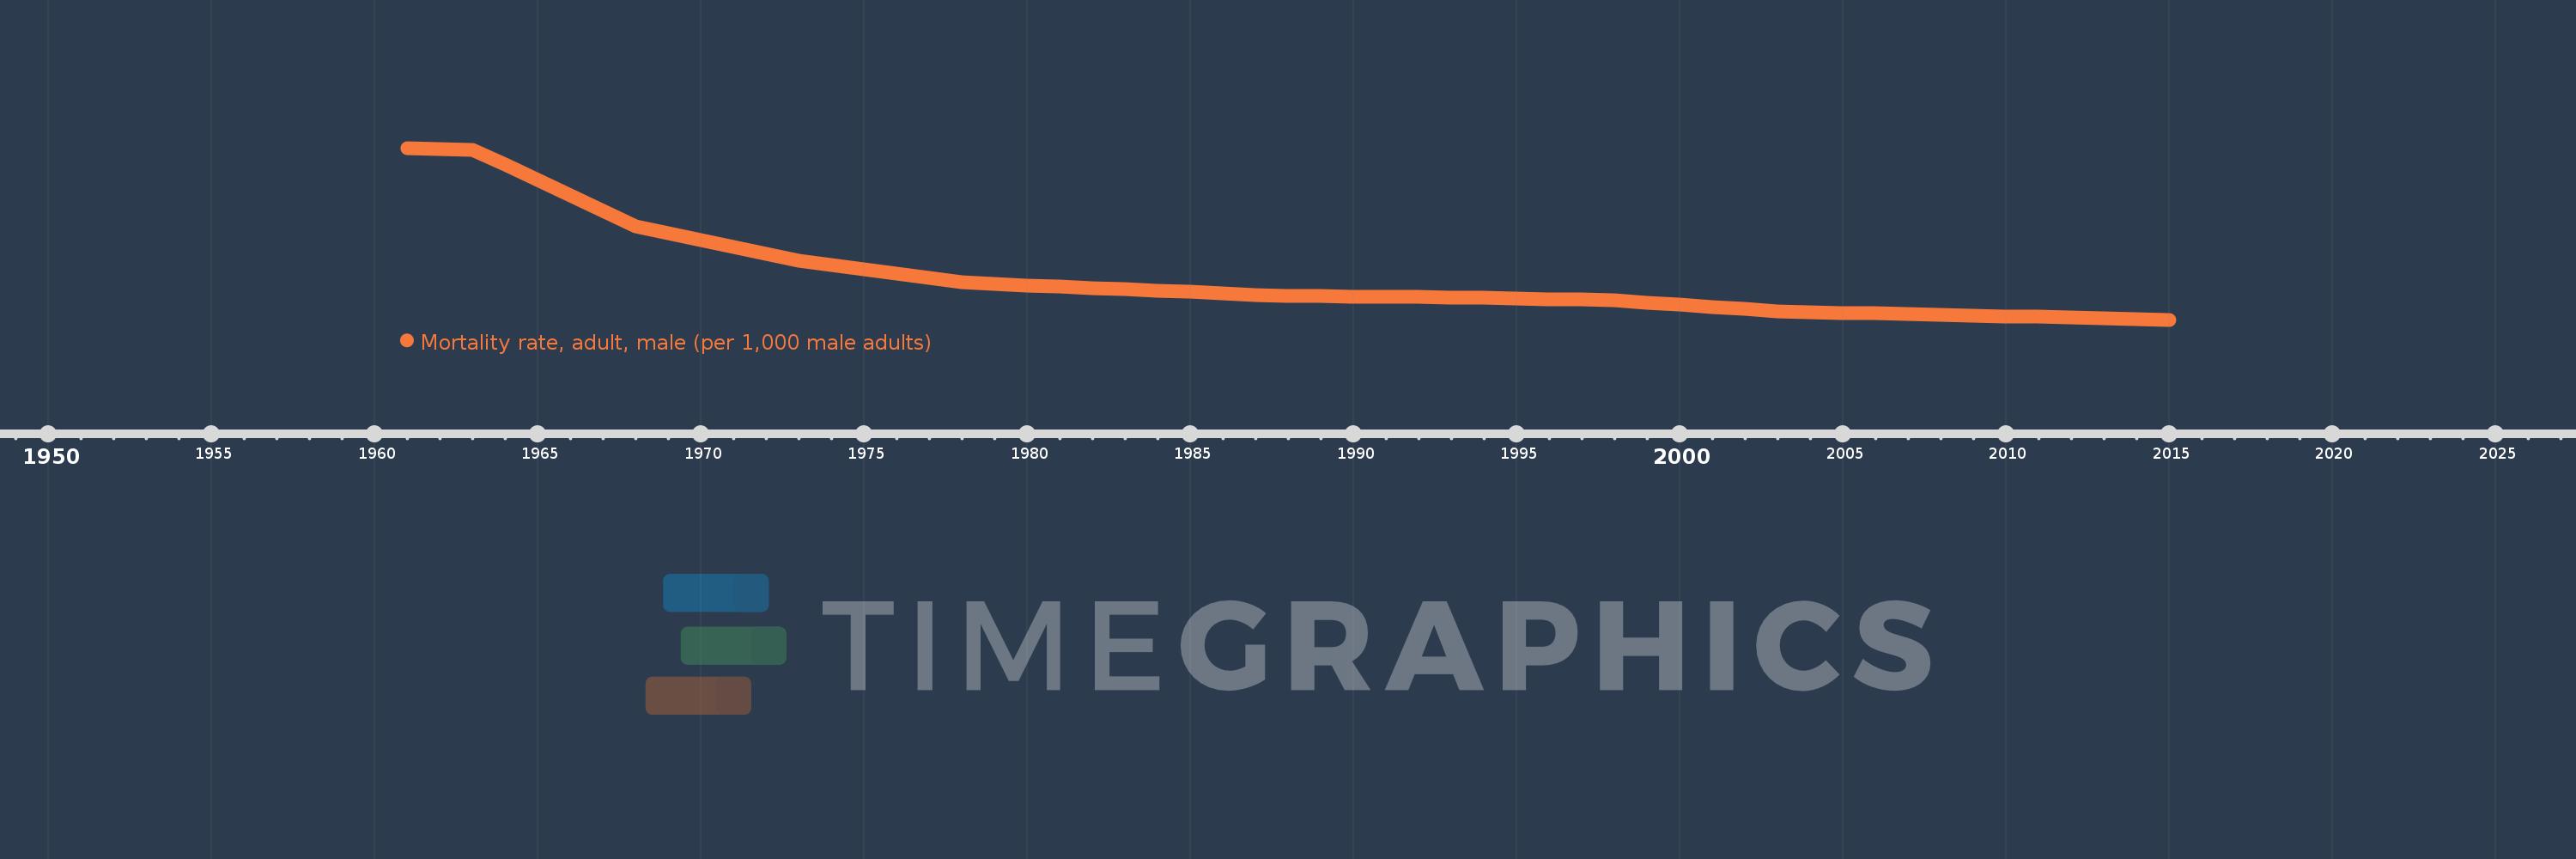
Mortality rate, adult, male (per 1,000 male adults)
2015,2014,2013,2012,2011,2010,2009,2008,2007,2006,2005,2004,2003,2002,2001,2000,1999,1998,1997,1996,1995,1994,1993,1992,1991,1990,1989,1988,1987,1986,1985,1984,1983,1982,1981,1980,1979,1978,1977,1976,1975,1974,1973,1972,1971,1970,1969,1968,1967,1966,1965,1964,1963,1962,1961
This statistics in other country:
AfghanistanAlbaniaAlgeriaAngolaAntigua and BarbudaArab WorldArgentinaArmeniaArubaAustraliaAustriaAzerbaijanBahamas, TheBahrainBangladeshBarbadosBelarusBelgiumBelizeBeninBhutanBoliviaBosnia and HerzegovinaBotswanaBrazilBrunei DarussalamBulgariaBurkina FasoBurundiCabo VerdeCambodiaCameroonCanadaCaribbean small statesCentral African RepublicCentral Europe and the BalticsChadChannel IslandsChileChinaColombiaComorosCongo, Dem. Rep.Congo, Rep.Costa RicaCote d'IvoireCroatiaCubaCuracaoCyprusCzech RepublicDenmarkDjiboutiDominicaDominican RepublicEarly-demographic dividendEast Asia & PacificEast Asia & Pacific (excluding high income)East Asia & Pacific (IDA & IBRD countries)EcuadorEgypt, Arab Rep.El SalvadorEquatorial GuineaEritreaEstoniaEthiopiaEuro areaEurope & Central AsiaEurope & Central Asia (excluding high income)Europe & Central Asia (IDA & IBRD countries)European UnionFijiFinlandFragile and conflict affected situationsFranceFrench PolynesiaGabonGambia, TheGeorgiaGermanyGhanaGreeceGreenlandGrenadaGuamGuatemalaGuineaGuinea-BissauGuyanaHaitiHeavily indebted poor countries (HIPC)High incomeHondurasHong Kong SAR, ChinaHungaryIBRD onlyIcelandIDA & IBRD totalIDA blendIDA onlyIDA totalIndiaIndonesiaIran, Islamic Rep.IraqIrelandIsraelItalyJamaicaJapanJordanKazakhstanKenyaKiribatiKorea, Dem. People’s Rep.Korea, Rep.KuwaitKyrgyz RepublicLao PDRLate-demographic dividendLatin America & Caribbean Latin America & Caribbean (excluding high income)Latin America & the Caribbean (IDA & IBRD countries)LatviaLeast developed countries: UN classificationLebanonLesothoLiberiaLibyaLithuaniaLow & middle incomeLow incomeLower middle incomeLuxembourgMacao SAR, ChinaMacedonia, FYRMadagascarMalawiMalaysiaMaldivesMaliMaltaMarshall IslandsMauritaniaMauritiusMexicoMicronesia, Fed. Sts.Middle East & North AfricaMiddle East & North Africa (excluding high income)Middle East & North Africa (IDA & IBRD countries)Middle incomeMoldovaMongoliaMontenegroMoroccoMozambiqueMyanmarNamibiaNepalNetherlandsNew CaledoniaNew ZealandNicaraguaNigerNigeriaNorth AmericaNorwayOECD membersOmanOther small statesPacific island small statesPakistanPanamaPapua New GuineaParaguayPeruPhilippinesPolandPortugalPost-demographic dividendPre-demographic dividendPuerto RicoQatarRomaniaRussian FederationRwandaSamoaSao Tome and PrincipeSaudi ArabiaSenegalSerbiaSeychellesSierra LeoneSingaporeSlovak RepublicSloveniaSmall statesSolomon IslandsSomaliaSouth AfricaSouth AsiaSouth Asia (IDA & IBRD)South SudanSpainSri LankaSt. Kitts and NevisSt. LuciaSt. Vincent and the GrenadinesSub-Saharan Africa Sub-Saharan Africa (excluding high income)Sub-Saharan Africa (IDA & IBRD countries)SudanSurinameSwazilandSwedenSwitzerlandSyrian Arab RepublicTajikistanTanzaniaThailandTimor-LesteTogoTongaTrinidad and TobagoTunisiaTurkeyTurkmenistanUgandaUkraineUnited Arab EmiratesUnited KingdomUnited StatesUpper middle incomeUruguayUzbekistanVanuatuVenezuela, RBVietnamVirgin Islands (U.S.)West Bank and GazaWorldYemen, Rep.ZambiaZimbabwe Timeline:
This timeline shows a graph from 1961 to 2015 of China. No data until 1960. Number of actual observations by date: 55.
Source name:
World Development Indicators
Source organization:
(1) United Nations Population Division. World Population Prospects. New York, United Nations, Department of Economic and Social Affairs (advanced Excel tables). Available at http://esa.un.org/wpp/unpp/panel_population.htm, (2) University of California, Berkeley, and Max Planck Institute for Demographic Research. Human Mortality Database. [ www.mortality.org or www.humanmortality.de].
Categories, topics:
Health, Gender
Last updated:
apr 23, 2017
Indicators value changes by year
Minimum:
98.448
jan 1, 2015
Maximum:
516.966
jan 1, 1961
At the date of observation
Value
Absolute change
Change from previous value
jan 1, 1961
516.966
+516.966
0.0%
jan 1, 1962
515.08
-1.886
-0.36%
jan 1, 1963
513.194
-1.886
-0.37%
jan 1, 1964
475.825
-37.369
-7.28%
jan 1, 1965
438.456
-37.369
-7.85%
jan 1, 1966
401.088
-37.368
-8.52%
jan 1, 1967
363.719
-37.369
-9.32%
jan 1, 1968
326.35
-37.369
-10.27%
jan 1, 1969
309.594
-16.756
-5.13%
jan 1, 1970
292.837
-16.757
-5.41%
jan 1, 1971
276.08
-16.757
-5.72%
jan 1, 1972
259.324
-16.756
-6.07%
jan 1, 1973
242.567
-16.757
-6.46%
jan 1, 1974
231.844
-10.723
-4.42%
jan 1, 1975
221.122
-10.722
-4.62%
jan 1, 1976
210.399
-10.723
-4.85%
jan 1, 1977
199.676
-10.723
-5.1%
jan 1, 1978
188.953
-10.723
-5.37%
jan 1, 1979
185.675
-3.278
-1.73%
jan 1, 1980
182.397
-3.278
-1.77%
jan 1, 1981
179.118
-3.279
-1.8%
jan 1, 1982
175.84
-3.278
-1.83%
jan 1, 1983
172.562
-3.278
-1.86%
jan 1, 1984
169.245
-3.317
-1.92%
jan 1, 1985
165.929
-3.316
-1.96%
jan 1, 1986
162.612
-3.317
-2.0%
jan 1, 1987
159.296
-3.316
-2.04%
jan 1, 1988
155.98
-3.316
-2.08%
jan 1, 1989
155.378
-0.602
-0.39%
jan 1, 1990
154.777
-0.601
-0.39%
jan 1, 1991
154.175
-0.602
-0.39%
jan 1, 1992
153.574
-0.601
-0.39%
jan 1, 1993
152.973
-0.601
-0.39%
jan 1, 1994
151.483
-1.49
-0.97%
jan 1, 1995
149.993
-1.49
-0.98%
jan 1, 1996
148.503
-1.49
-0.99%
jan 1, 1997
147.013
-1.49
-1.0%
jan 1, 1998
145.523
-1.49
-1.01%
jan 1, 1999
140.199
-5.324
-3.66%
jan 1, 2000
134.875
-5.324
-3.8%
jan 1, 2001
129.552
-5.323
-3.95%
jan 1, 2002
124.228
-5.324
-4.11%
jan 1, 2003
118.904
-5.324
-4.29%
jan 1, 2004
117.165
-1.739
-1.46%
jan 1, 2005
115.425
-1.74
-1.49%
jan 1, 2006
113.686
-1.739
-1.51%
jan 1, 2007
111.947
-1.739
-1.53%
jan 1, 2008
110.207
-1.74
-1.55%
jan 1, 2009
108.594
-1.613
-1.46%
jan 1, 2010
106.981
-1.613
-1.49%
jan 1, 2011
105.368
-1.613
-1.51%
jan 1, 2012
103.755
-1.613
-1.53%
jan 1, 2013
102.142
-1.613
-1.55%
jan 1, 2014
100.295
-1.847
-1.81%
jan 1, 2015
98.448
-1.847
-1.84%
Ranking of countries by current statistics by years


Comments: