29
/
en
AIzaSyAYiBZKx7MnpbEhh9jyipgxe19OcubqV5w
April 1, 2024
79716
Barbados
BRB
true
2
1
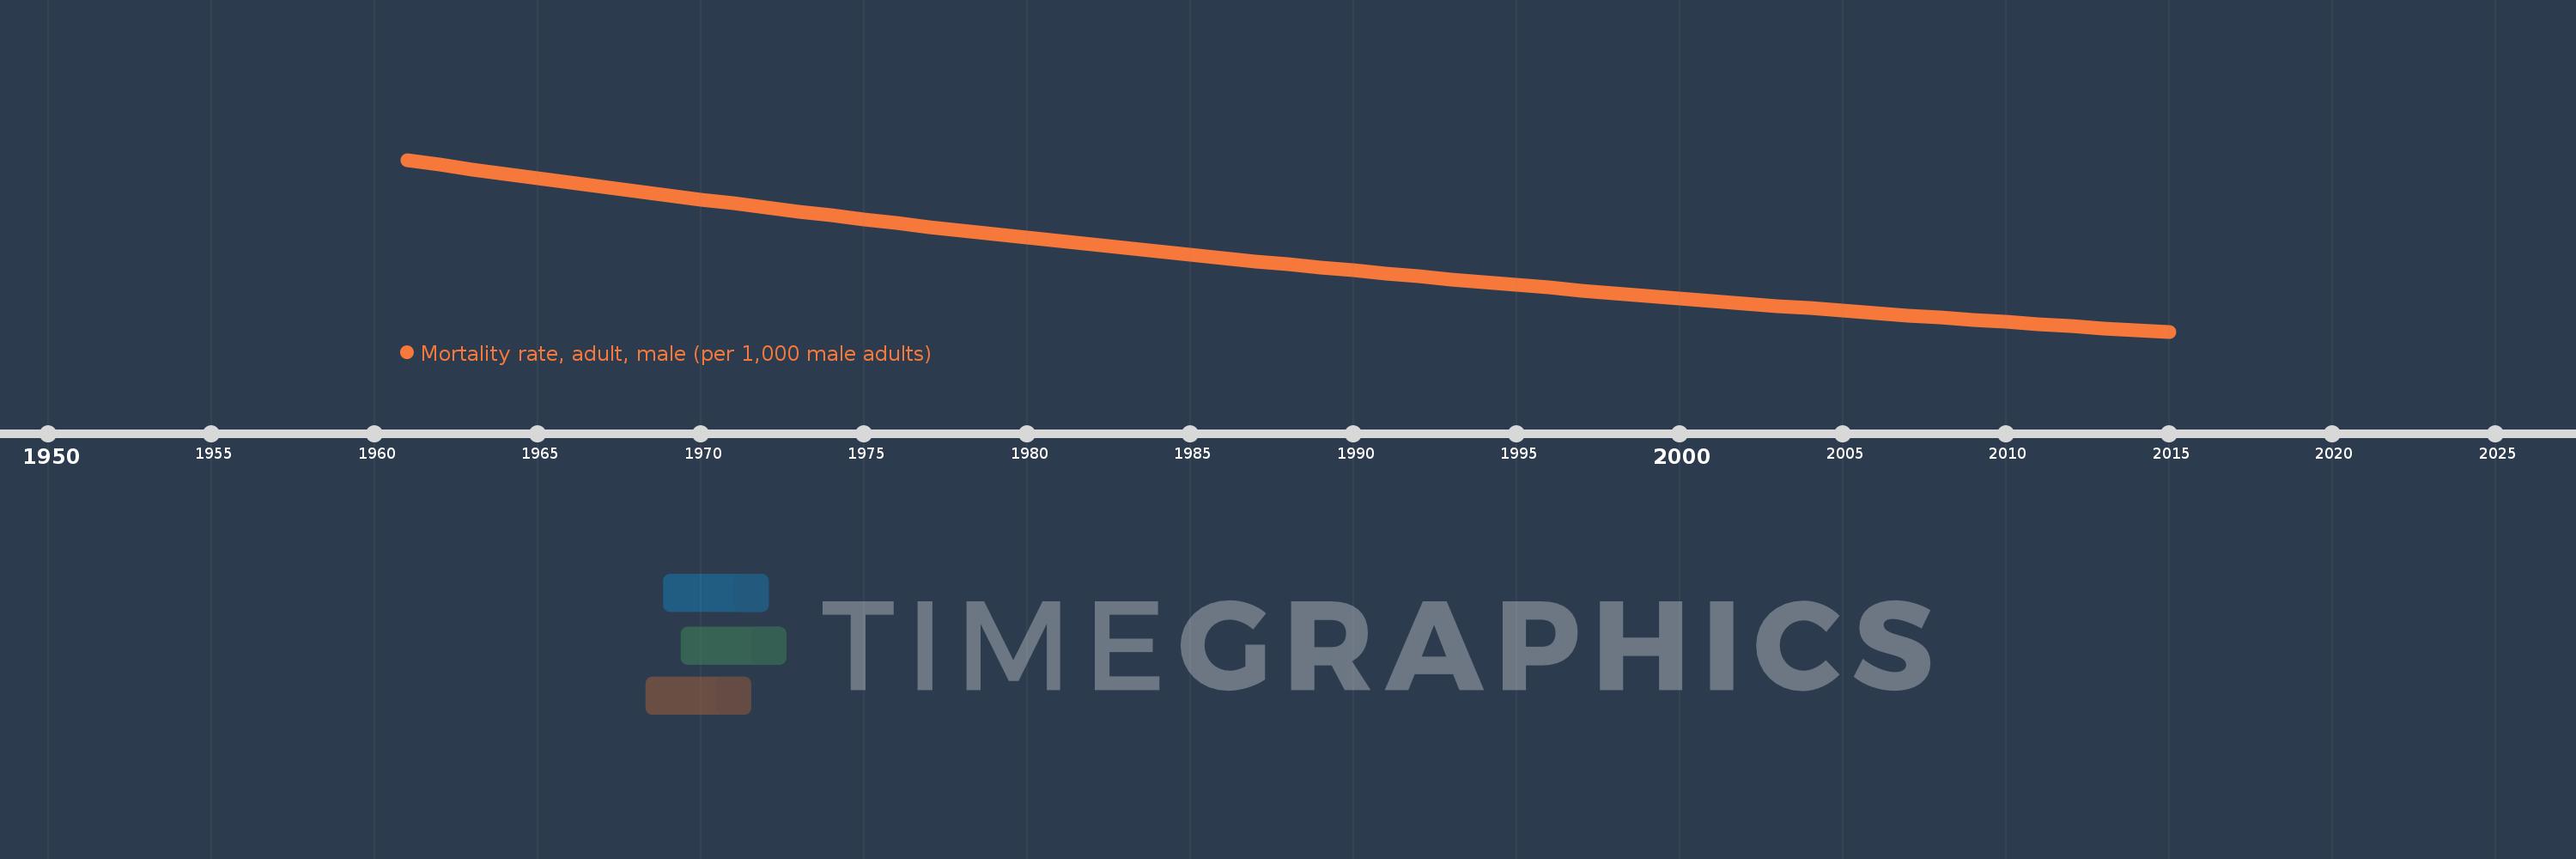
Mortality rate, adult, male (per 1,000 male adults)
2015,2014,2013,2012,2011,2010,2009,2008,2007,2006,2005,2004,2003,2002,2001,2000,1999,1998,1997,1996,1995,1994,1993,1992,1991,1990,1989,1988,1987,1986,1985,1984,1983,1982,1981,1980,1979,1978,1977,1976,1975,1974,1973,1972,1971,1970,1969,1968,1967,1966,1965,1964,1963,1962,1961
This statistics in other country:
AfghanistanAlbaniaAlgeriaAngolaAntigua and BarbudaArab WorldArgentinaArmeniaArubaAustraliaAustriaAzerbaijanBahamas, TheBahrainBangladeshBarbadosBelarusBelgiumBelizeBeninBhutanBoliviaBosnia and HerzegovinaBotswanaBrazilBrunei DarussalamBulgariaBurkina FasoBurundiCabo VerdeCambodiaCameroonCanadaCaribbean small statesCentral African RepublicCentral Europe and the BalticsChadChannel IslandsChileChinaColombiaComorosCongo, Dem. Rep.Congo, Rep.Costa RicaCote d'IvoireCroatiaCubaCuracaoCyprusCzech RepublicDenmarkDjiboutiDominicaDominican RepublicEarly-demographic dividendEast Asia & PacificEast Asia & Pacific (excluding high income)East Asia & Pacific (IDA & IBRD countries)EcuadorEgypt, Arab Rep.El SalvadorEquatorial GuineaEritreaEstoniaEthiopiaEuro areaEurope & Central AsiaEurope & Central Asia (excluding high income)Europe & Central Asia (IDA & IBRD countries)European UnionFijiFinlandFragile and conflict affected situationsFranceFrench PolynesiaGabonGambia, TheGeorgiaGermanyGhanaGreeceGreenlandGrenadaGuamGuatemalaGuineaGuinea-BissauGuyanaHaitiHeavily indebted poor countries (HIPC)High incomeHondurasHong Kong SAR, ChinaHungaryIBRD onlyIcelandIDA & IBRD totalIDA blendIDA onlyIDA totalIndiaIndonesiaIran, Islamic Rep.IraqIrelandIsraelItalyJamaicaJapanJordanKazakhstanKenyaKiribatiKorea, Dem. People’s Rep.Korea, Rep.KuwaitKyrgyz RepublicLao PDRLate-demographic dividendLatin America & Caribbean Latin America & Caribbean (excluding high income)Latin America & the Caribbean (IDA & IBRD countries)LatviaLeast developed countries: UN classificationLebanonLesothoLiberiaLibyaLithuaniaLow & middle incomeLow incomeLower middle incomeLuxembourgMacao SAR, ChinaMacedonia, FYRMadagascarMalawiMalaysiaMaldivesMaliMaltaMarshall IslandsMauritaniaMauritiusMexicoMicronesia, Fed. Sts.Middle East & North AfricaMiddle East & North Africa (excluding high income)Middle East & North Africa (IDA & IBRD countries)Middle incomeMoldovaMongoliaMontenegroMoroccoMozambiqueMyanmarNamibiaNepalNetherlandsNew CaledoniaNew ZealandNicaraguaNigerNigeriaNorth AmericaNorwayOECD membersOmanOther small statesPacific island small statesPakistanPanamaPapua New GuineaParaguayPeruPhilippinesPolandPortugalPost-demographic dividendPre-demographic dividendPuerto RicoQatarRomaniaRussian FederationRwandaSamoaSao Tome and PrincipeSaudi ArabiaSenegalSerbiaSeychellesSierra LeoneSingaporeSlovak RepublicSloveniaSmall statesSolomon IslandsSomaliaSouth AfricaSouth AsiaSouth Asia (IDA & IBRD)South SudanSpainSri LankaSt. Kitts and NevisSt. LuciaSt. Vincent and the GrenadinesSub-Saharan Africa Sub-Saharan Africa (excluding high income)Sub-Saharan Africa (IDA & IBRD countries)SudanSurinameSwazilandSwedenSwitzerlandSyrian Arab RepublicTajikistanTanzaniaThailandTimor-LesteTogoTongaTrinidad and TobagoTunisiaTurkeyTurkmenistanUgandaUkraineUnited Arab EmiratesUnited KingdomUnited StatesUpper middle incomeUruguayUzbekistanVanuatuVenezuela, RBVietnamVirgin Islands (U.S.)West Bank and GazaWorldYemen, Rep.ZambiaZimbabwe Timeline:
This timeline shows a graph from 1961 to 2015 of Barbados. No data until 1960. Number of actual observations by date: 55.
Source name:
World Development Indicators
Source organization:
(1) United Nations Population Division. World Population Prospects. New York, United Nations, Department of Economic and Social Affairs (advanced Excel tables). Available at http://esa.un.org/wpp/unpp/panel_population.htm, (2) University of California, Berkeley, and Max Planck Institute for Demographic Research. Human Mortality Database. [ www.mortality.org or www.humanmortality.de].
Categories, topics:
Health, Gender
Last updated:
apr 23, 2017
Indicators value changes by year
Minimum:
125.449
jan 1, 2015
Maximum:
294.136
jan 1, 1961
At the date of observation
Value
Absolute change
Change from previous value
jan 1, 1961
294.136
+294.136
0.0%
jan 1, 1962
289.485
-4.651
-1.58%
jan 1, 1963
284.835
-4.65
-1.61%
jan 1, 1964
280.508
-4.327
-1.52%
jan 1, 1965
276.181
-4.327
-1.54%
jan 1, 1966
271.854
-4.327
-1.57%
jan 1, 1967
267.527
-4.327
-1.59%
jan 1, 1968
263.2
-4.327
-1.62%
jan 1, 1969
259.183
-4.017
-1.53%
jan 1, 1970
255.165
-4.018
-1.55%
jan 1, 1971
251.148
-4.017
-1.57%
jan 1, 1972
247.131
-4.017
-1.6%
jan 1, 1973
243.114
-4.017
-1.63%
jan 1, 1974
239.391
-3.723
-1.53%
jan 1, 1975
235.668
-3.723
-1.56%
jan 1, 1976
231.945
-3.723
-1.58%
jan 1, 1977
228.222
-3.723
-1.61%
jan 1, 1978
224.499
-3.723
-1.63%
jan 1, 1979
221.054
-3.445
-1.53%
jan 1, 1980
217.609
-3.445
-1.56%
jan 1, 1981
214.164
-3.445
-1.58%
jan 1, 1982
210.719
-3.445
-1.61%
jan 1, 1983
207.274
-3.445
-1.63%
jan 1, 1984
204.091
-3.183
-1.54%
jan 1, 1985
200.907
-3.184
-1.56%
jan 1, 1986
197.724
-3.183
-1.58%
jan 1, 1987
194.54
-3.184
-1.61%
jan 1, 1988
191.357
-3.183
-1.64%
jan 1, 1989
188.418
-2.939
-1.54%
jan 1, 1990
185.479
-2.939
-1.56%
jan 1, 1991
182.54
-2.939
-1.58%
jan 1, 1992
179.601
-2.939
-1.61%
jan 1, 1993
176.662
-2.939
-1.64%
jan 1, 1994
173.951
-2.711
-1.53%
jan 1, 1995
171.24
-2.711
-1.56%
jan 1, 1996
168.529
-2.711
-1.58%
jan 1, 1997
165.818
-2.711
-1.61%
jan 1, 1998
163.107
-2.711
-1.63%
jan 1, 1999
160.608
-2.499
-1.53%
jan 1, 2000
158.109
-2.499
-1.56%
jan 1, 2001
155.61
-2.499
-1.58%
jan 1, 2002
153.111
-2.499
-1.61%
jan 1, 2003
150.612
-2.499
-1.63%
jan 1, 2004
148.31
-2.302
-1.53%
jan 1, 2005
146.007
-2.303
-1.55%
jan 1, 2006
143.705
-2.302
-1.58%
jan 1, 2007
141.402
-2.303
-1.6%
jan 1, 2008
139.1
-2.302
-1.63%
jan 1, 2009
136.983
-2.117
-1.52%
jan 1, 2010
134.866
-2.117
-1.55%
jan 1, 2011
132.75
-2.116
-1.57%
jan 1, 2012
130.633
-2.117
-1.59%
jan 1, 2013
128.516
-2.117
-1.62%
jan 1, 2014
126.983
-1.533
-1.19%
jan 1, 2015
125.449
-1.534
-1.21%
Ranking of countries by current statistics by years


Comments: