29
/
en
AIzaSyAYiBZKx7MnpbEhh9jyipgxe19OcubqV5w
April 1, 2024
194550
Mauritius
MUS
true
2
1
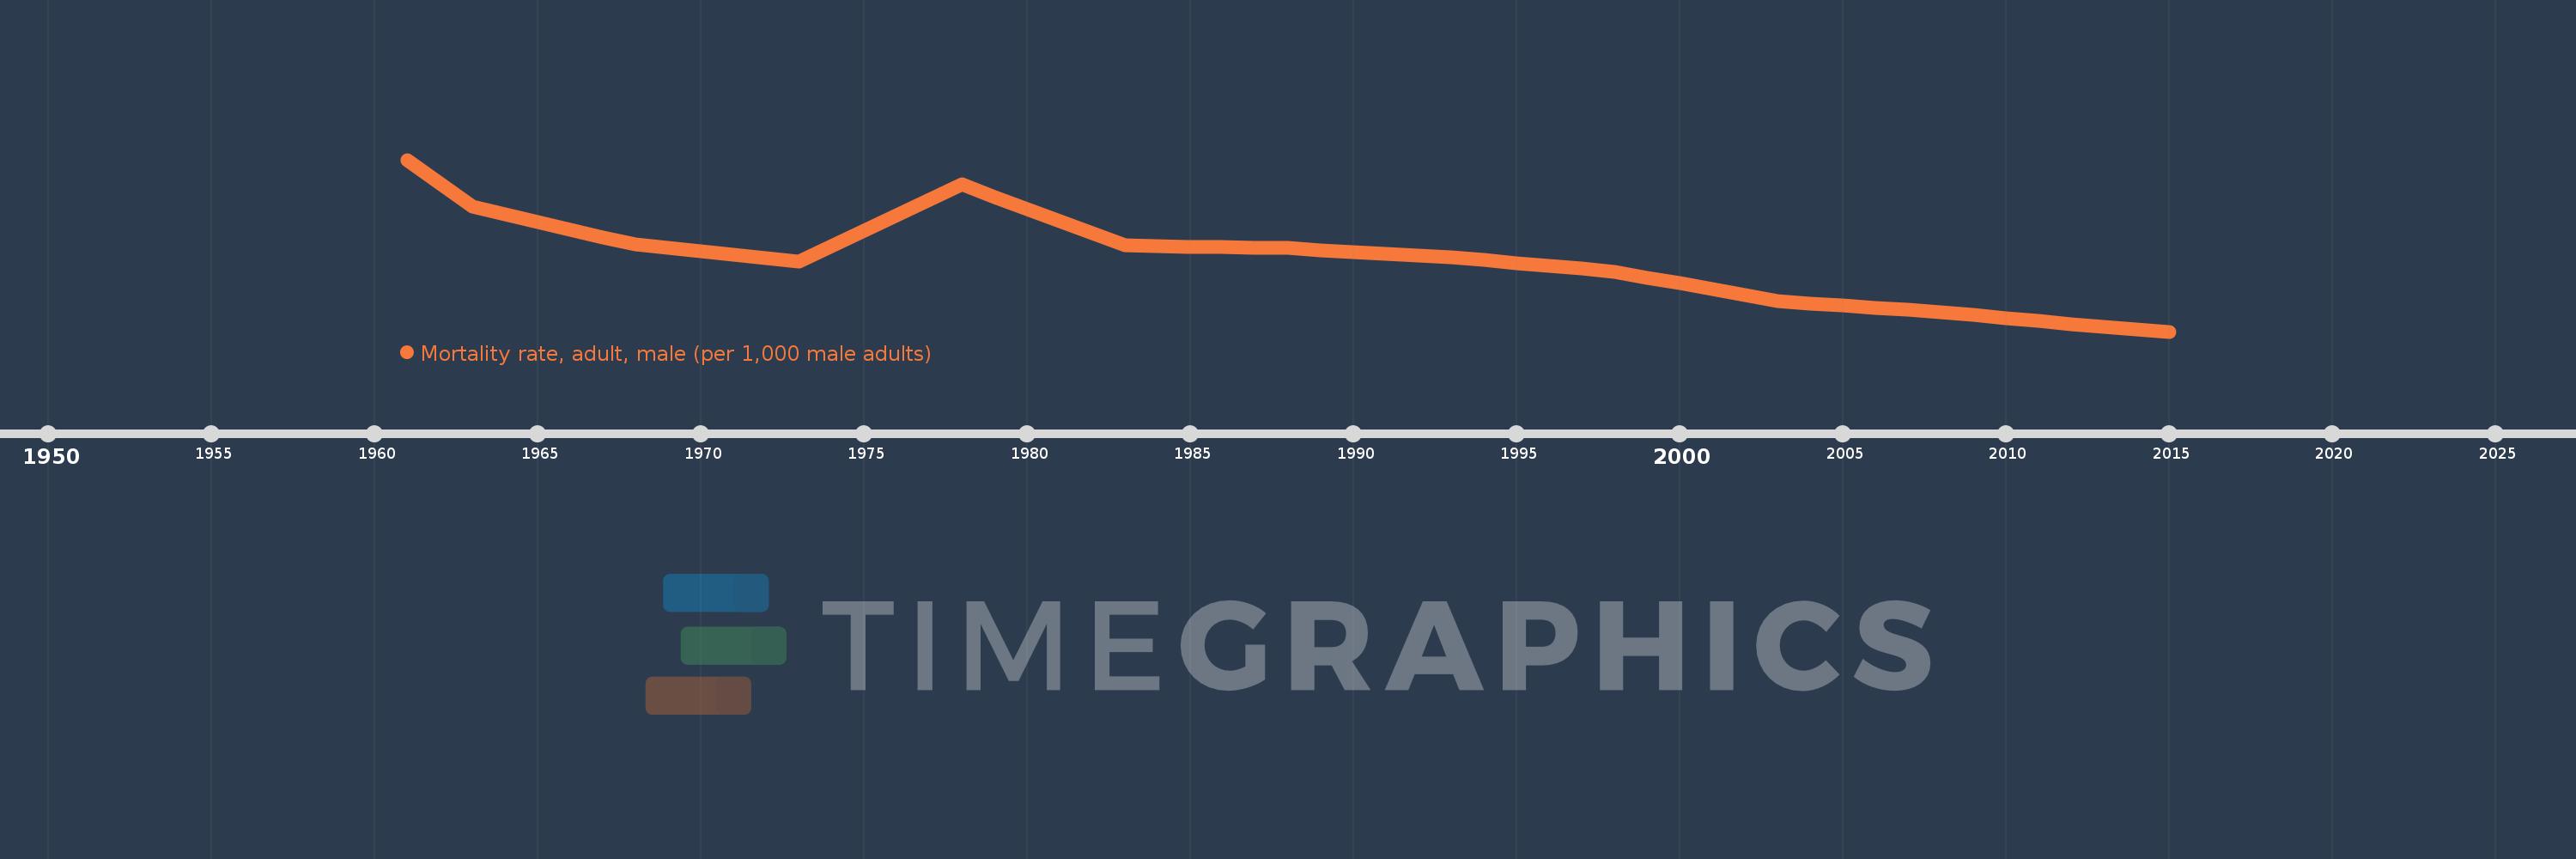
Mortality rate, adult, male (per 1,000 male adults)
2015,2014,2013,2012,2011,2010,2009,2008,2007,2006,2005,2004,2003,2002,2001,2000,1999,1998,1997,1996,1995,1994,1993,1992,1991,1990,1989,1988,1987,1986,1985,1984,1983,1982,1981,1980,1979,1978,1977,1976,1975,1974,1973,1972,1971,1970,1969,1968,1967,1966,1965,1964,1963,1962,1961
This statistics in other country:
AfghanistanAlbaniaAlgeriaAngolaAntigua and BarbudaArab WorldArgentinaArmeniaArubaAustraliaAustriaAzerbaijanBahamas, TheBahrainBangladeshBarbadosBelarusBelgiumBelizeBeninBhutanBoliviaBosnia and HerzegovinaBotswanaBrazilBrunei DarussalamBulgariaBurkina FasoBurundiCabo VerdeCambodiaCameroonCanadaCaribbean small statesCentral African RepublicCentral Europe and the BalticsChadChannel IslandsChileChinaColombiaComorosCongo, Dem. Rep.Congo, Rep.Costa RicaCote d'IvoireCroatiaCubaCuracaoCyprusCzech RepublicDenmarkDjiboutiDominicaDominican RepublicEarly-demographic dividendEast Asia & PacificEast Asia & Pacific (excluding high income)East Asia & Pacific (IDA & IBRD countries)EcuadorEgypt, Arab Rep.El SalvadorEquatorial GuineaEritreaEstoniaEthiopiaEuro areaEurope & Central AsiaEurope & Central Asia (excluding high income)Europe & Central Asia (IDA & IBRD countries)European UnionFijiFinlandFragile and conflict affected situationsFranceFrench PolynesiaGabonGambia, TheGeorgiaGermanyGhanaGreeceGreenlandGrenadaGuamGuatemalaGuineaGuinea-BissauGuyanaHaitiHeavily indebted poor countries (HIPC)High incomeHondurasHong Kong SAR, ChinaHungaryIBRD onlyIcelandIDA & IBRD totalIDA blendIDA onlyIDA totalIndiaIndonesiaIran, Islamic Rep.IraqIrelandIsraelItalyJamaicaJapanJordanKazakhstanKenyaKiribatiKorea, Dem. People’s Rep.Korea, Rep.KuwaitKyrgyz RepublicLao PDRLate-demographic dividendLatin America & Caribbean Latin America & Caribbean (excluding high income)Latin America & the Caribbean (IDA & IBRD countries)LatviaLeast developed countries: UN classificationLebanonLesothoLiberiaLibyaLithuaniaLow & middle incomeLow incomeLower middle incomeLuxembourgMacao SAR, ChinaMacedonia, FYRMadagascarMalawiMalaysiaMaldivesMaliMaltaMarshall IslandsMauritaniaMauritiusMexicoMicronesia, Fed. Sts.Middle East & North AfricaMiddle East & North Africa (excluding high income)Middle East & North Africa (IDA & IBRD countries)Middle incomeMoldovaMongoliaMontenegroMoroccoMozambiqueMyanmarNamibiaNepalNetherlandsNew CaledoniaNew ZealandNicaraguaNigerNigeriaNorth AmericaNorwayOECD membersOmanOther small statesPacific island small statesPakistanPanamaPapua New GuineaParaguayPeruPhilippinesPolandPortugalPost-demographic dividendPre-demographic dividendPuerto RicoQatarRomaniaRussian FederationRwandaSamoaSao Tome and PrincipeSaudi ArabiaSenegalSerbiaSeychellesSierra LeoneSingaporeSlovak RepublicSloveniaSmall statesSolomon IslandsSomaliaSouth AfricaSouth AsiaSouth Asia (IDA & IBRD)South SudanSpainSri LankaSt. Kitts and NevisSt. LuciaSt. Vincent and the GrenadinesSub-Saharan Africa Sub-Saharan Africa (excluding high income)Sub-Saharan Africa (IDA & IBRD countries)SudanSurinameSwazilandSwedenSwitzerlandSyrian Arab RepublicTajikistanTanzaniaThailandTimor-LesteTogoTongaTrinidad and TobagoTunisiaTurkeyTurkmenistanUgandaUkraineUnited Arab EmiratesUnited KingdomUnited StatesUpper middle incomeUruguayUzbekistanVanuatuVenezuela, RBVietnamVirgin Islands (U.S.)West Bank and GazaWorldYemen, Rep.ZambiaZimbabwe Timeline:
This timeline shows a graph from 1961 to 2015 of Mauritius. No data until 1960. Number of actual observations by date: 55.
Source name:
World Development Indicators
Source organization:
(1) United Nations Population Division. World Population Prospects. New York, United Nations, Department of Economic and Social Affairs (advanced Excel tables). Available at http://esa.un.org/wpp/unpp/panel_population.htm, (2) University of California, Berkeley, and Max Planck Institute for Demographic Research. Human Mortality Database. [ www.mortality.org or www.humanmortality.de].
Categories, topics:
Health, Gender
Last updated:
apr 23, 2017
Indicators value changes by year
Minimum:
193.935
jan 1, 2015
Maximum:
347.093
jan 1, 1961
At the date of observation
Value
Absolute change
Change from previous value
jan 1, 1961
347.093
+347.093
0.0%
jan 1, 1962
326.077
-21.016
-6.05%
jan 1, 1963
305.061
-21.016
-6.45%
jan 1, 1964
298.322
-6.739
-2.21%
jan 1, 1965
291.584
-6.738
-2.26%
jan 1, 1966
284.845
-6.739
-2.31%
jan 1, 1967
278.106
-6.739
-2.37%
jan 1, 1968
271.368
-6.738
-2.42%
jan 1, 1969
268.32
-3.048
-1.12%
jan 1, 1970
265.272
-3.048
-1.14%
jan 1, 1971
262.225
-3.047
-1.15%
jan 1, 1972
259.177
-3.048
-1.16%
jan 1, 1973
256.129
-3.048
-1.18%
jan 1, 1974
269.907
+13.778
5.38%
jan 1, 1975
283.685
+13.778
5.1%
jan 1, 1976
297.463
+13.778
4.86%
jan 1, 1977
311.241
+13.778
4.63%
jan 1, 1978
325.018
+13.777
4.43%
jan 1, 1979
314.147
-10.871
-3.34%
jan 1, 1980
303.276
-10.871
-3.46%
jan 1, 1981
292.405
-10.871
-3.58%
jan 1, 1982
281.534
-10.871
-3.72%
jan 1, 1983
270.663
-10.871
-3.86%
jan 1, 1984
270.189
-0.474
-0.18%
jan 1, 1985
269.715
-0.474
-0.18%
jan 1, 1986
269.24
-0.475
-0.18%
jan 1, 1987
268.766
-0.474
-0.18%
jan 1, 1988
268.292
-0.474
-0.18%
jan 1, 1989
266.683
-1.609
-0.6%
jan 1, 1990
265.075
-1.608
-0.6%
jan 1, 1991
263.467
-1.608
-0.61%
jan 1, 1992
261.858
-1.609
-0.61%
jan 1, 1993
260.25
-1.608
-0.61%
jan 1, 1994
257.663
-2.587
-0.99%
jan 1, 1995
255.077
-2.586
-1.0%
jan 1, 1996
252.49
-2.587
-1.01%
jan 1, 1997
249.903
-2.587
-1.02%
jan 1, 1998
247.317
-2.586
-1.03%
jan 1, 1999
242.082
-5.235
-2.12%
jan 1, 2000
236.846
-5.236
-2.16%
jan 1, 2001
231.611
-5.235
-2.21%
jan 1, 2002
226.376
-5.235
-2.26%
jan 1, 2003
221.141
-5.235
-2.31%
jan 1, 2004
219.138
-2.003
-0.91%
jan 1, 2005
217.136
-2.002
-0.91%
jan 1, 2006
215.134
-2.002
-0.92%
jan 1, 2007
213.131
-2.003
-0.93%
jan 1, 2008
211.129
-2.002
-0.94%
jan 1, 2009
208.504
-2.625
-1.24%
jan 1, 2010
205.88
-2.624
-1.26%
jan 1, 2011
203.255
-2.625
-1.28%
jan 1, 2012
200.63
-2.625
-1.29%
jan 1, 2013
198.005
-2.625
-1.31%
jan 1, 2014
195.97
-2.035
-1.03%
jan 1, 2015
193.935
-2.035
-1.04%
Ranking of countries by current statistics by years


Comments: