29
/
en
AIzaSyAYiBZKx7MnpbEhh9jyipgxe19OcubqV5w
April 1, 2024
24316
Arab World
ARB
false
2
1
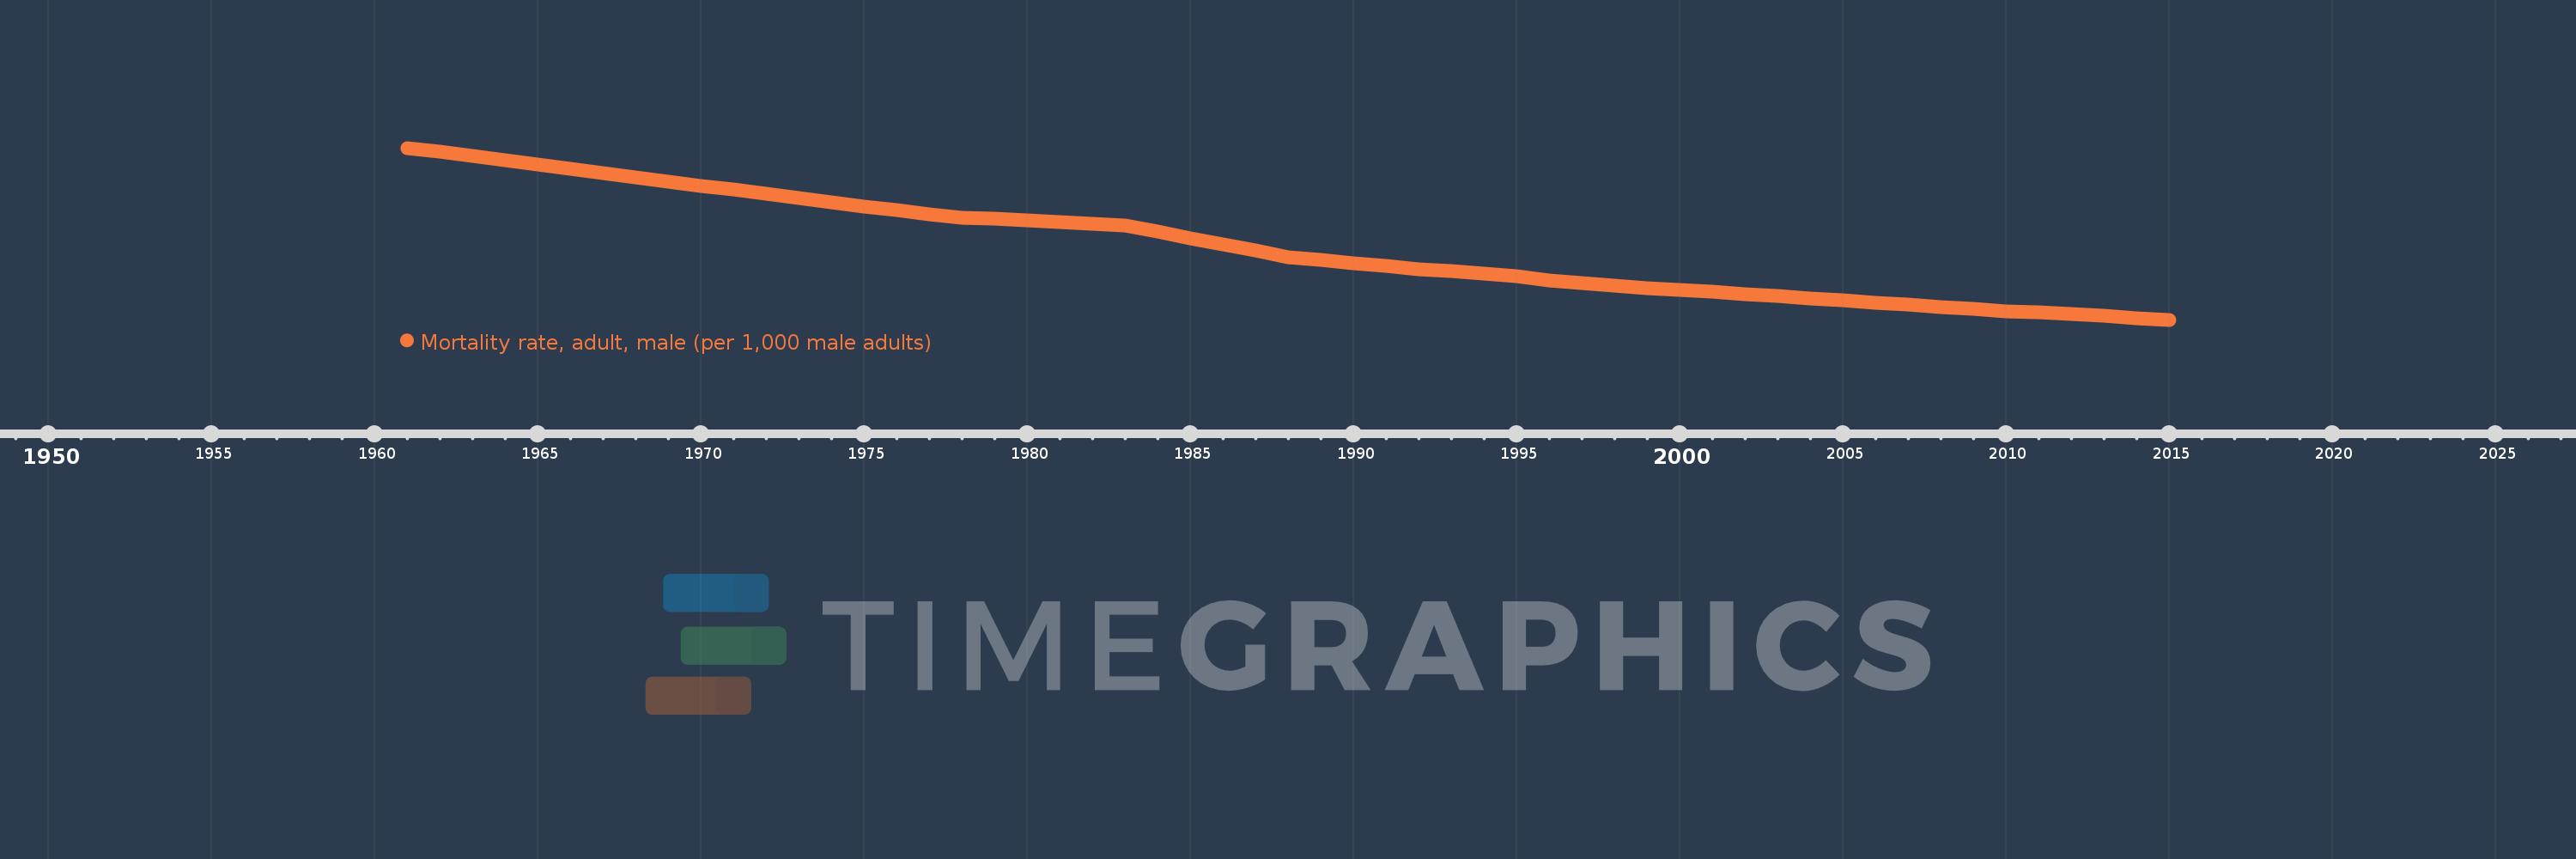
Mortality rate, adult, male (per 1,000 male adults)
2015,2014,2013,2012,2011,2010,2009,2008,2007,2006,2005,2004,2003,2002,2001,2000,1999,1998,1997,1996,1995,1994,1993,1992,1991,1990,1989,1988,1987,1986,1985,1984,1983,1982,1981,1980,1979,1978,1977,1976,1975,1974,1973,1972,1971,1970,1969,1968,1967,1966,1965,1964,1963,1962,1961
This statistics in other country:
AfghanistanAlbaniaAlgeriaAngolaAntigua and BarbudaArab WorldArgentinaArmeniaArubaAustraliaAustriaAzerbaijanBahamas, TheBahrainBangladeshBarbadosBelarusBelgiumBelizeBeninBhutanBoliviaBosnia and HerzegovinaBotswanaBrazilBrunei DarussalamBulgariaBurkina FasoBurundiCabo VerdeCambodiaCameroonCanadaCaribbean small statesCentral African RepublicCentral Europe and the BalticsChadChannel IslandsChileChinaColombiaComorosCongo, Dem. Rep.Congo, Rep.Costa RicaCote d'IvoireCroatiaCubaCuracaoCyprusCzech RepublicDenmarkDjiboutiDominicaDominican RepublicEarly-demographic dividendEast Asia & PacificEast Asia & Pacific (excluding high income)East Asia & Pacific (IDA & IBRD countries)EcuadorEgypt, Arab Rep.El SalvadorEquatorial GuineaEritreaEstoniaEthiopiaEuro areaEurope & Central AsiaEurope & Central Asia (excluding high income)Europe & Central Asia (IDA & IBRD countries)European UnionFijiFinlandFragile and conflict affected situationsFranceFrench PolynesiaGabonGambia, TheGeorgiaGermanyGhanaGreeceGreenlandGrenadaGuamGuatemalaGuineaGuinea-BissauGuyanaHaitiHeavily indebted poor countries (HIPC)High incomeHondurasHong Kong SAR, ChinaHungaryIBRD onlyIcelandIDA & IBRD totalIDA blendIDA onlyIDA totalIndiaIndonesiaIran, Islamic Rep.IraqIrelandIsraelItalyJamaicaJapanJordanKazakhstanKenyaKiribatiKorea, Dem. People’s Rep.Korea, Rep.KuwaitKyrgyz RepublicLao PDRLate-demographic dividendLatin America & Caribbean Latin America & Caribbean (excluding high income)Latin America & the Caribbean (IDA & IBRD countries)LatviaLeast developed countries: UN classificationLebanonLesothoLiberiaLibyaLithuaniaLow & middle incomeLow incomeLower middle incomeLuxembourgMacao SAR, ChinaMacedonia, FYRMadagascarMalawiMalaysiaMaldivesMaliMaltaMarshall IslandsMauritaniaMauritiusMexicoMicronesia, Fed. Sts.Middle East & North AfricaMiddle East & North Africa (excluding high income)Middle East & North Africa (IDA & IBRD countries)Middle incomeMoldovaMongoliaMontenegroMoroccoMozambiqueMyanmarNamibiaNepalNetherlandsNew CaledoniaNew ZealandNicaraguaNigerNigeriaNorth AmericaNorwayOECD membersOmanOther small statesPacific island small statesPakistanPanamaPapua New GuineaParaguayPeruPhilippinesPolandPortugalPost-demographic dividendPre-demographic dividendPuerto RicoQatarRomaniaRussian FederationRwandaSamoaSao Tome and PrincipeSaudi ArabiaSenegalSerbiaSeychellesSierra LeoneSingaporeSlovak RepublicSloveniaSmall statesSolomon IslandsSomaliaSouth AfricaSouth AsiaSouth Asia (IDA & IBRD)South SudanSpainSri LankaSt. Kitts and NevisSt. LuciaSt. Vincent and the GrenadinesSub-Saharan Africa Sub-Saharan Africa (excluding high income)Sub-Saharan Africa (IDA & IBRD countries)SudanSurinameSwazilandSwedenSwitzerlandSyrian Arab RepublicTajikistanTanzaniaThailandTimor-LesteTogoTongaTrinidad and TobagoTunisiaTurkeyTurkmenistanUgandaUkraineUnited Arab EmiratesUnited KingdomUnited StatesUpper middle incomeUruguayUzbekistanVanuatuVenezuela, RBVietnamVirgin Islands (U.S.)West Bank and GazaWorldYemen, Rep.ZambiaZimbabwe Timeline:
This timeline shows a graph from 1961 to 2015 of Arab World. No data until 1960. Number of actual observations by date: 55.
Source name:
World Development Indicators
Source organization:
(1) United Nations Population Division. World Population Prospects. New York, United Nations, Department of Economic and Social Affairs (advanced Excel tables). Available at http://esa.un.org/wpp/unpp/panel_population.htm, (2) University of California, Berkeley, and Max Planck Institute for Demographic Research. Human Mortality Database. [ www.mortality.org or www.humanmortality.de].
Categories, topics:
Health, Gender
Last updated:
apr 23, 2017
Indicators value changes by year
Minimum:
169.507
jan 1, 2015
Maximum:
357.687
jan 1, 1961
At the date of observation
Value
Absolute change
Change from previous value
jan 1, 1961
357.687
+357.687
0.0%
jan 1, 1962
353.232
-4.455
-1.25%
jan 1, 1963
348.695
-4.536
-1.28%
jan 1, 1964
343.991
-4.704
-1.35%
jan 1, 1965
339.288
-4.703
-1.37%
jan 1, 1966
334.611
-4.677
-1.38%
jan 1, 1967
329.97
-4.641
-1.39%
jan 1, 1968
325.367
-4.603
-1.39%
jan 1, 1969
320.921
-4.446
-1.37%
jan 1, 1970
316.452
-4.469
-1.39%
jan 1, 1971
311.952
-4.501
-1.42%
jan 1, 1972
307.371
-4.581
-1.47%
jan 1, 1973
302.76
-4.611
-1.5%
jan 1, 1974
298.202
-4.558
-1.51%
jan 1, 1975
293.748
-4.454
-1.49%
jan 1, 1976
289.419
-4.329
-1.47%
jan 1, 1977
285.294
-4.124
-1.43%
jan 1, 1978
281.266
-4.028
-1.41%
jan 1, 1979
279.982
-1.284
-0.46%
jan 1, 1980
278.555
-1.427
-0.51%
jan 1, 1981
276.951
-1.604
-0.58%
jan 1, 1982
274.942
-2.009
-0.73%
jan 1, 1983
272.743
-2.199
-0.8%
jan 1, 1984
265.774
-6.969
-2.56%
jan 1, 1985
258.833
-6.941
-2.61%
jan 1, 1986
251.928
-6.904
-2.67%
jan 1, 1987
245.097
-6.831
-2.71%
jan 1, 1988
238.322
-6.776
-2.76%
jan 1, 1989
234.907
-3.414
-1.43%
jan 1, 1990
231.583
-3.324
-1.42%
jan 1, 1991
228.065
-3.519
-1.52%
jan 1, 1992
224.806
-3.258
-1.43%
jan 1, 1993
222.773
-2.033
-0.9%
jan 1, 1994
219.763
-3.01
-1.35%
jan 1, 1995
216.75
-3.013
-1.37%
jan 1, 1996
212.796
-3.954
-1.82%
jan 1, 1997
209.75
-3.046
-1.43%
jan 1, 1998
206.704
-3.046
-1.45%
jan 1, 1999
204.454
-2.251
-1.09%
jan 1, 2000
202.222
-2.232
-1.09%
jan 1, 2001
200.002
-2.22
-1.1%
jan 1, 2002
197.665
-2.337
-1.17%
jan 1, 2003
195.302
-2.363
-1.2%
jan 1, 2004
193.057
-2.245
-1.15%
jan 1, 2005
190.748
-2.31
-1.2%
jan 1, 2006
188.358
-2.389
-1.25%
jan 1, 2007
185.719
-2.639
-1.4%
jan 1, 2008
183.04
-2.68
-1.44%
jan 1, 2009
181.002
-2.037
-1.11%
jan 1, 2010
179.094
-1.908
-1.05%
jan 1, 2011
177.3
-1.794
-1.0%
jan 1, 2012
175.477
-1.823
-1.03%
jan 1, 2013
173.545
-1.932
-1.1%
jan 1, 2014
171.446
-2.099
-1.21%
jan 1, 2015
169.507
-1.938
-1.13%
Ranking of countries by current statistics by years


Comments: