29
/
en
AIzaSyAYiBZKx7MnpbEhh9jyipgxe19OcubqV5w
April 1, 2024
116473
Curacao
CUW
true
2
1
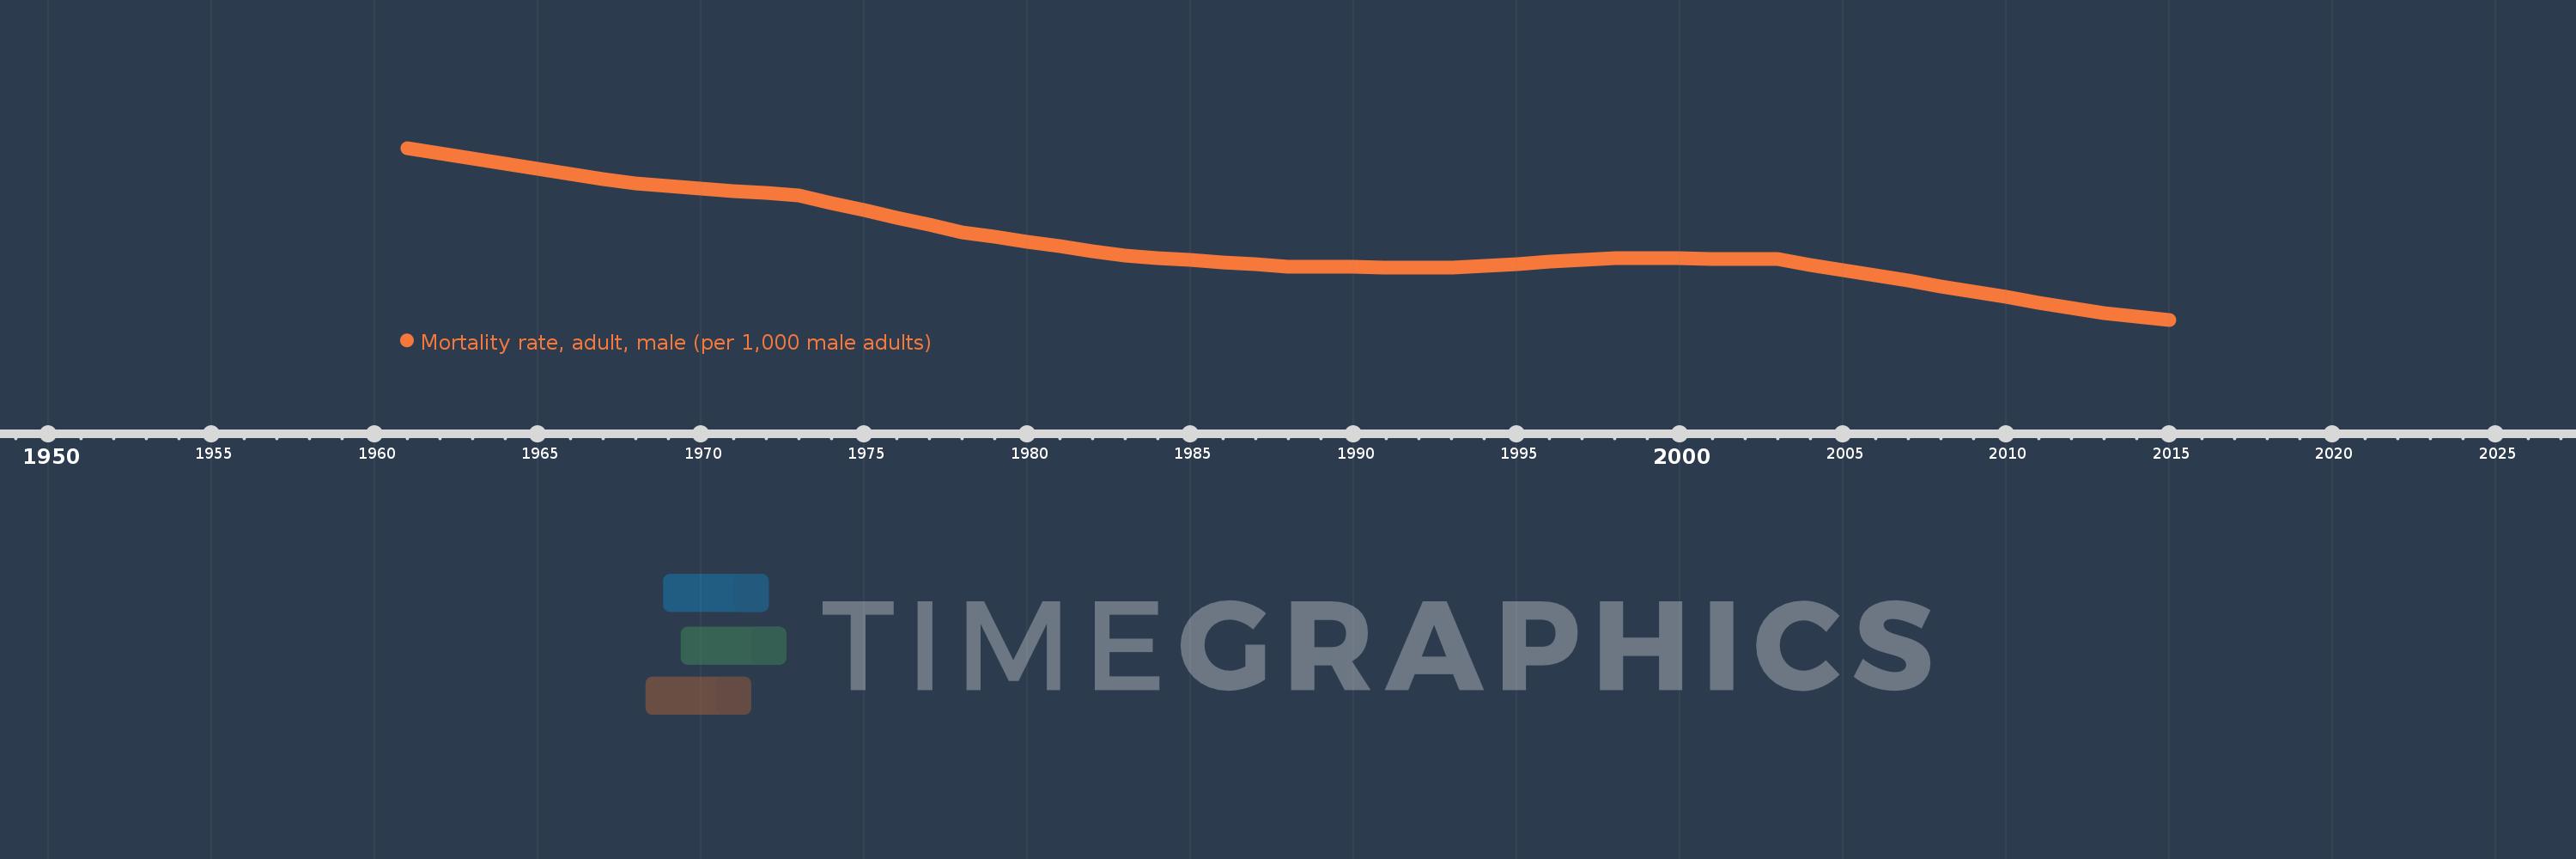
Mortality rate, adult, male (per 1,000 male adults)
2015,2014,2013,2012,2011,2010,2009,2008,2007,2006,2005,2004,2003,2002,2001,2000,1999,1998,1997,1996,1995,1994,1993,1992,1991,1990,1989,1988,1987,1986,1985,1984,1983,1982,1981,1980,1979,1978,1977,1976,1975,1974,1973,1972,1971,1970,1969,1968,1967,1966,1965,1964,1963,1962,1961
This statistics in other country:
AfghanistanAlbaniaAlgeriaAngolaAntigua and BarbudaArab WorldArgentinaArmeniaArubaAustraliaAustriaAzerbaijanBahamas, TheBahrainBangladeshBarbadosBelarusBelgiumBelizeBeninBhutanBoliviaBosnia and HerzegovinaBotswanaBrazilBrunei DarussalamBulgariaBurkina FasoBurundiCabo VerdeCambodiaCameroonCanadaCaribbean small statesCentral African RepublicCentral Europe and the BalticsChadChannel IslandsChileChinaColombiaComorosCongo, Dem. Rep.Congo, Rep.Costa RicaCote d'IvoireCroatiaCubaCuracaoCyprusCzech RepublicDenmarkDjiboutiDominicaDominican RepublicEarly-demographic dividendEast Asia & PacificEast Asia & Pacific (excluding high income)East Asia & Pacific (IDA & IBRD countries)EcuadorEgypt, Arab Rep.El SalvadorEquatorial GuineaEritreaEstoniaEthiopiaEuro areaEurope & Central AsiaEurope & Central Asia (excluding high income)Europe & Central Asia (IDA & IBRD countries)European UnionFijiFinlandFragile and conflict affected situationsFranceFrench PolynesiaGabonGambia, TheGeorgiaGermanyGhanaGreeceGreenlandGrenadaGuamGuatemalaGuineaGuinea-BissauGuyanaHaitiHeavily indebted poor countries (HIPC)High incomeHondurasHong Kong SAR, ChinaHungaryIBRD onlyIcelandIDA & IBRD totalIDA blendIDA onlyIDA totalIndiaIndonesiaIran, Islamic Rep.IraqIrelandIsraelItalyJamaicaJapanJordanKazakhstanKenyaKiribatiKorea, Dem. People’s Rep.Korea, Rep.KuwaitKyrgyz RepublicLao PDRLate-demographic dividendLatin America & Caribbean Latin America & Caribbean (excluding high income)Latin America & the Caribbean (IDA & IBRD countries)LatviaLeast developed countries: UN classificationLebanonLesothoLiberiaLibyaLithuaniaLow & middle incomeLow incomeLower middle incomeLuxembourgMacao SAR, ChinaMacedonia, FYRMadagascarMalawiMalaysiaMaldivesMaliMaltaMarshall IslandsMauritaniaMauritiusMexicoMicronesia, Fed. Sts.Middle East & North AfricaMiddle East & North Africa (excluding high income)Middle East & North Africa (IDA & IBRD countries)Middle incomeMoldovaMongoliaMontenegroMoroccoMozambiqueMyanmarNamibiaNepalNetherlandsNew CaledoniaNew ZealandNicaraguaNigerNigeriaNorth AmericaNorwayOECD membersOmanOther small statesPacific island small statesPakistanPanamaPapua New GuineaParaguayPeruPhilippinesPolandPortugalPost-demographic dividendPre-demographic dividendPuerto RicoQatarRomaniaRussian FederationRwandaSamoaSao Tome and PrincipeSaudi ArabiaSenegalSerbiaSeychellesSierra LeoneSingaporeSlovak RepublicSloveniaSmall statesSolomon IslandsSomaliaSouth AfricaSouth AsiaSouth Asia (IDA & IBRD)South SudanSpainSri LankaSt. Kitts and NevisSt. LuciaSt. Vincent and the GrenadinesSub-Saharan Africa Sub-Saharan Africa (excluding high income)Sub-Saharan Africa (IDA & IBRD countries)SudanSurinameSwazilandSwedenSwitzerlandSyrian Arab RepublicTajikistanTanzaniaThailandTimor-LesteTogoTongaTrinidad and TobagoTunisiaTurkeyTurkmenistanUgandaUkraineUnited Arab EmiratesUnited KingdomUnited StatesUpper middle incomeUruguayUzbekistanVanuatuVenezuela, RBVietnamVirgin Islands (U.S.)West Bank and GazaWorldYemen, Rep.ZambiaZimbabwe Timeline:
This timeline shows a graph from 1961 to 2015 of Curacao. No data until 1960. Number of actual observations by date: 55.
Source name:
World Development Indicators
Source organization:
(1) United Nations Population Division. World Population Prospects. New York, United Nations, Department of Economic and Social Affairs (advanced Excel tables). Available at http://esa.un.org/wpp/unpp/panel_population.htm, (2) University of California, Berkeley, and Max Planck Institute for Demographic Research. Human Mortality Database. [ www.mortality.org or www.humanmortality.de].
Categories, topics:
Health, Gender
Last updated:
apr 23, 2017
Indicators value changes by year
Minimum:
137.834
jan 1, 2015
Maximum:
248.814
jan 1, 1961
At the date of observation
Value
Absolute change
Change from previous value
jan 1, 1961
248.814
+248.814
0.0%
jan 1, 1962
245.421
-3.393
-1.36%
jan 1, 1963
242.029
-3.392
-1.38%
jan 1, 1964
238.751
-3.278
-1.35%
jan 1, 1965
235.473
-3.278
-1.37%
jan 1, 1966
232.195
-3.278
-1.39%
jan 1, 1967
228.917
-3.278
-1.41%
jan 1, 1968
225.638
-3.279
-1.43%
jan 1, 1969
224.139
-1.499
-0.66%
jan 1, 1970
222.639
-1.5
-0.67%
jan 1, 1971
221.139
-1.5
-0.67%
jan 1, 1972
219.639
-1.5
-0.68%
jan 1, 1973
218.14
-1.499
-0.68%
jan 1, 1974
213.405
-4.735
-2.17%
jan 1, 1975
208.67
-4.735
-2.22%
jan 1, 1976
203.935
-4.735
-2.27%
jan 1, 1977
199.2
-4.735
-2.32%
jan 1, 1978
194.465
-4.735
-2.38%
jan 1, 1979
191.396
-3.069
-1.58%
jan 1, 1980
188.327
-3.069
-1.6%
jan 1, 1981
185.258
-3.069
-1.63%
jan 1, 1982
182.189
-3.069
-1.66%
jan 1, 1983
179.12
-3.069
-1.68%
jan 1, 1984
177.743
-1.377
-0.77%
jan 1, 1985
176.366
-1.377
-0.77%
jan 1, 1986
174.989
-1.377
-0.78%
jan 1, 1987
173.612
-1.377
-0.79%
jan 1, 1988
172.235
-1.377
-0.79%
jan 1, 1989
172.065
-0.17
-0.1%
jan 1, 1990
171.895
-0.17
-0.1%
jan 1, 1991
171.725
-0.17
-0.1%
jan 1, 1992
171.555
-0.17
-0.1%
jan 1, 1993
171.385
-0.17
-0.1%
jan 1, 1994
172.67
+1.285
0.75%
jan 1, 1995
173.955
+1.285
0.74%
jan 1, 1996
175.24
+1.285
0.74%
jan 1, 1997
176.525
+1.285
0.73%
jan 1, 1998
177.81
+1.285
0.73%
jan 1, 1999
177.608
-0.202
-0.11%
jan 1, 2000
177.406
-0.202
-0.11%
jan 1, 2001
177.205
-0.201
-0.11%
jan 1, 2002
177.003
-0.202
-0.11%
jan 1, 2003
176.802
-0.201
-0.11%
jan 1, 2004
173.343
-3.459
-1.96%
jan 1, 2005
169.884
-3.459
-2.0%
jan 1, 2006
166.425
-3.459
-2.04%
jan 1, 2007
162.966
-3.459
-2.08%
jan 1, 2008
159.507
-3.459
-2.12%
jan 1, 2009
155.977
-3.53
-2.21%
jan 1, 2010
152.447
-3.53
-2.26%
jan 1, 2011
148.917
-3.53
-2.32%
jan 1, 2012
145.387
-3.53
-2.37%
jan 1, 2013
141.858
-3.529
-2.43%
jan 1, 2014
139.846
-2.012
-1.42%
jan 1, 2015
137.834
-2.012
-1.44%
Ranking of countries by current statistics by years


Comments: