29
/
en
AIzaSyAYiBZKx7MnpbEhh9jyipgxe19OcubqV5w
April 1, 2024
183154
Macao SAR, China
MAC
true
2
1
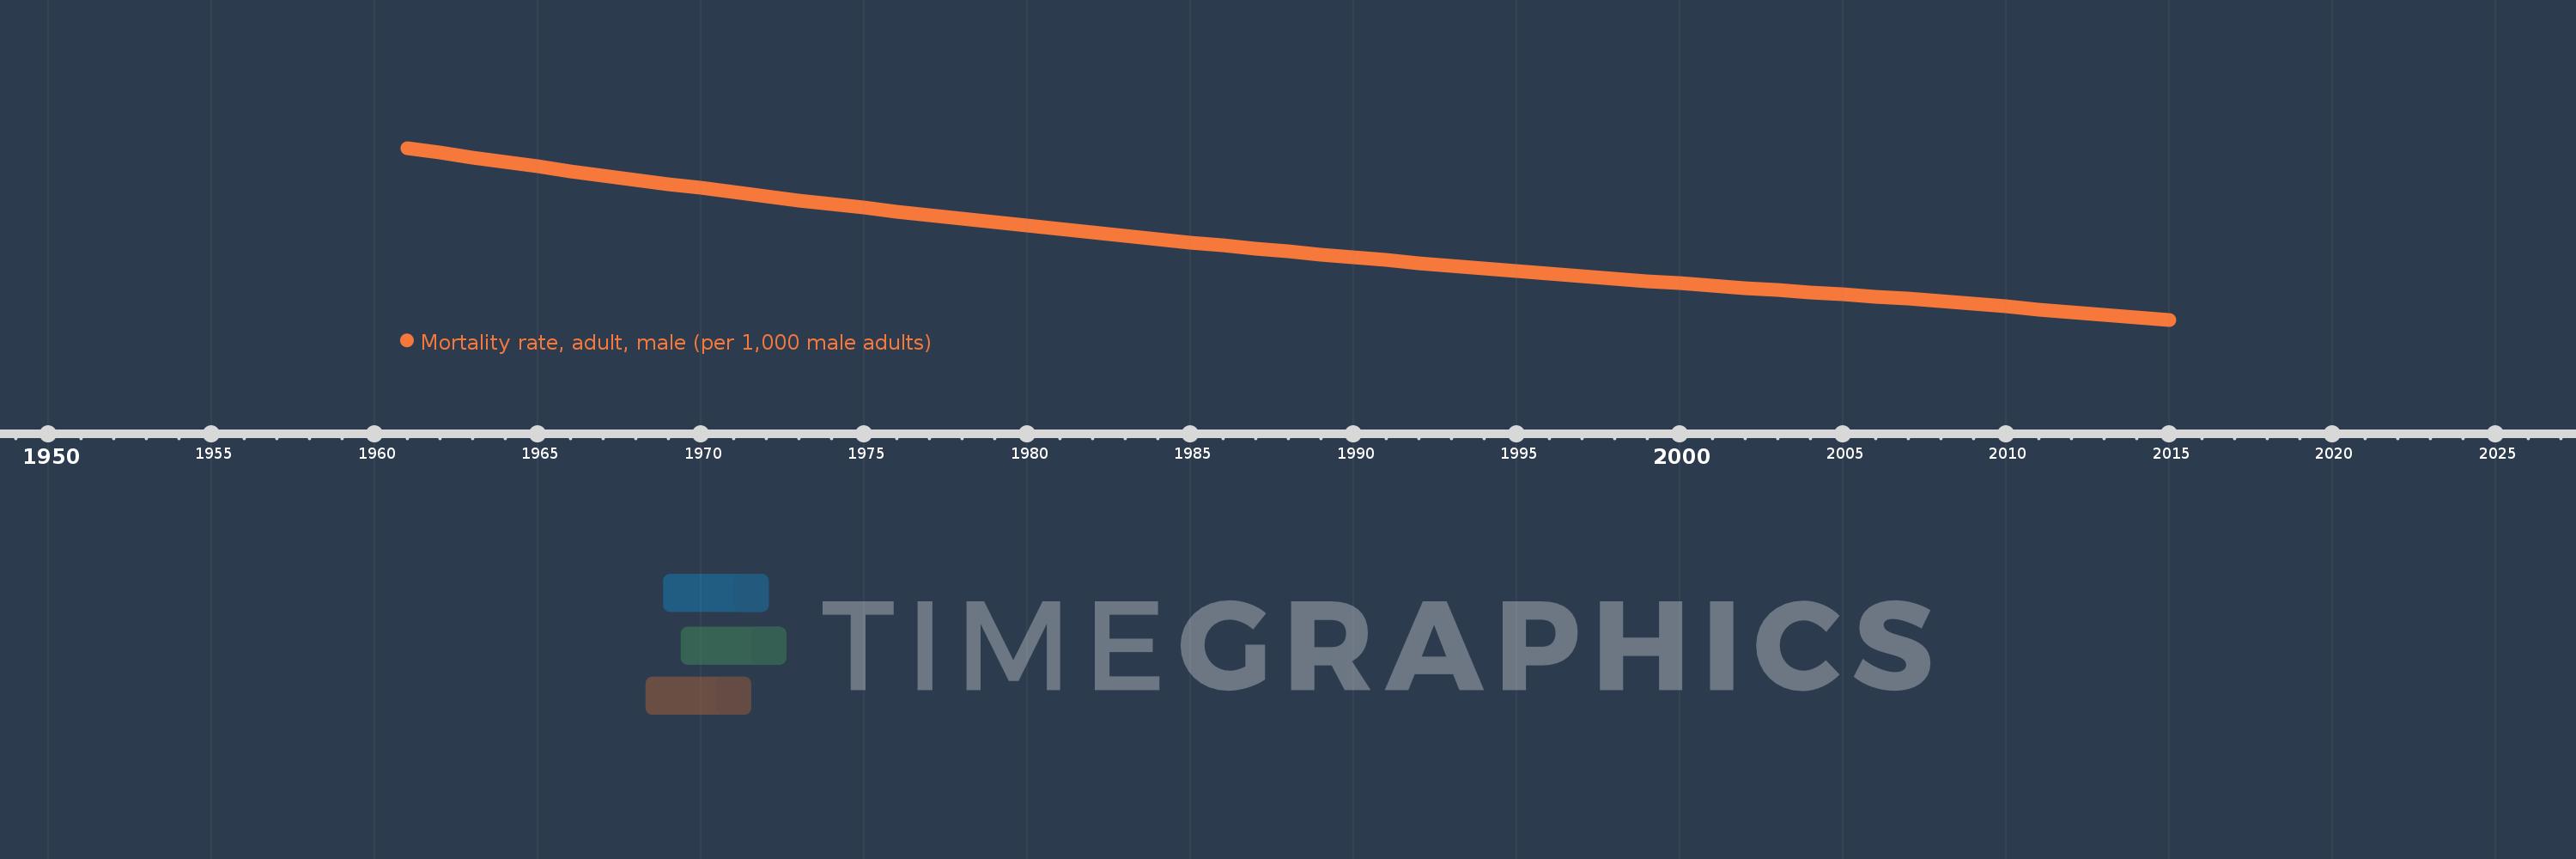
Mortality rate, adult, male (per 1,000 male adults)
2015,2014,2013,2012,2011,2010,2009,2008,2007,2006,2005,2004,2003,2002,2001,2000,1999,1998,1997,1996,1995,1994,1993,1992,1991,1990,1989,1988,1987,1986,1985,1984,1983,1982,1981,1980,1979,1978,1977,1976,1975,1974,1973,1972,1971,1970,1969,1968,1967,1966,1965,1964,1963,1962,1961
This statistics in other country:
AfghanistanAlbaniaAlgeriaAngolaAntigua and BarbudaArab WorldArgentinaArmeniaArubaAustraliaAustriaAzerbaijanBahamas, TheBahrainBangladeshBarbadosBelarusBelgiumBelizeBeninBhutanBoliviaBosnia and HerzegovinaBotswanaBrazilBrunei DarussalamBulgariaBurkina FasoBurundiCabo VerdeCambodiaCameroonCanadaCaribbean small statesCentral African RepublicCentral Europe and the BalticsChadChannel IslandsChileChinaColombiaComorosCongo, Dem. Rep.Congo, Rep.Costa RicaCote d'IvoireCroatiaCubaCuracaoCyprusCzech RepublicDenmarkDjiboutiDominicaDominican RepublicEarly-demographic dividendEast Asia & PacificEast Asia & Pacific (excluding high income)East Asia & Pacific (IDA & IBRD countries)EcuadorEgypt, Arab Rep.El SalvadorEquatorial GuineaEritreaEstoniaEthiopiaEuro areaEurope & Central AsiaEurope & Central Asia (excluding high income)Europe & Central Asia (IDA & IBRD countries)European UnionFijiFinlandFragile and conflict affected situationsFranceFrench PolynesiaGabonGambia, TheGeorgiaGermanyGhanaGreeceGreenlandGrenadaGuamGuatemalaGuineaGuinea-BissauGuyanaHaitiHeavily indebted poor countries (HIPC)High incomeHondurasHong Kong SAR, ChinaHungaryIBRD onlyIcelandIDA & IBRD totalIDA blendIDA onlyIDA totalIndiaIndonesiaIran, Islamic Rep.IraqIrelandIsraelItalyJamaicaJapanJordanKazakhstanKenyaKiribatiKorea, Dem. People’s Rep.Korea, Rep.KuwaitKyrgyz RepublicLao PDRLate-demographic dividendLatin America & Caribbean Latin America & Caribbean (excluding high income)Latin America & the Caribbean (IDA & IBRD countries)LatviaLeast developed countries: UN classificationLebanonLesothoLiberiaLibyaLithuaniaLow & middle incomeLow incomeLower middle incomeLuxembourgMacao SAR, ChinaMacedonia, FYRMadagascarMalawiMalaysiaMaldivesMaliMaltaMarshall IslandsMauritaniaMauritiusMexicoMicronesia, Fed. Sts.Middle East & North AfricaMiddle East & North Africa (excluding high income)Middle East & North Africa (IDA & IBRD countries)Middle incomeMoldovaMongoliaMontenegroMoroccoMozambiqueMyanmarNamibiaNepalNetherlandsNew CaledoniaNew ZealandNicaraguaNigerNigeriaNorth AmericaNorwayOECD membersOmanOther small statesPacific island small statesPakistanPanamaPapua New GuineaParaguayPeruPhilippinesPolandPortugalPost-demographic dividendPre-demographic dividendPuerto RicoQatarRomaniaRussian FederationRwandaSamoaSao Tome and PrincipeSaudi ArabiaSenegalSerbiaSeychellesSierra LeoneSingaporeSlovak RepublicSloveniaSmall statesSolomon IslandsSomaliaSouth AfricaSouth AsiaSouth Asia (IDA & IBRD)South SudanSpainSri LankaSt. Kitts and NevisSt. LuciaSt. Vincent and the GrenadinesSub-Saharan Africa Sub-Saharan Africa (excluding high income)Sub-Saharan Africa (IDA & IBRD countries)SudanSurinameSwazilandSwedenSwitzerlandSyrian Arab RepublicTajikistanTanzaniaThailandTimor-LesteTogoTongaTrinidad and TobagoTunisiaTurkeyTurkmenistanUgandaUkraineUnited Arab EmiratesUnited KingdomUnited StatesUpper middle incomeUruguayUzbekistanVanuatuVenezuela, RBVietnamVirgin Islands (U.S.)West Bank and GazaWorldYemen, Rep.ZambiaZimbabwe Timeline:
This timeline shows a graph from 1961 to 2015 of Macao SAR, China. No data until 1960. Number of actual observations by date: 55.
Source name:
World Development Indicators
Source organization:
(1) United Nations Population Division. World Population Prospects. New York, United Nations, Department of Economic and Social Affairs (advanced Excel tables). Available at http://esa.un.org/wpp/unpp/panel_population.htm, (2) University of California, Berkeley, and Max Planck Institute for Demographic Research. Human Mortality Database. [ www.mortality.org or www.humanmortality.de].
Categories, topics:
Health, Gender
Last updated:
apr 23, 2017
Indicators value changes by year
Maximum:
238.588
jan 1, 1961
At the date of observation
Value
Absolute change
Change from previous value
jan 1, 1961
238.588
+238.588
0.0%
jan 1, 1962
233.98
-4.608
-1.93%
jan 1, 1963
229.373
-4.607
-1.97%
jan 1, 1964
225.136
-4.237
-1.85%
jan 1, 1965
220.9
-4.236
-1.88%
jan 1, 1966
216.664
-4.236
-1.92%
jan 1, 1967
212.427
-4.237
-1.96%
jan 1, 1968
208.191
-4.236
-1.99%
jan 1, 1969
204.306
-3.885
-1.87%
jan 1, 1970
200.422
-3.884
-1.9%
jan 1, 1971
196.537
-3.885
-1.94%
jan 1, 1972
192.652
-3.885
-1.98%
jan 1, 1973
188.767
-3.885
-2.02%
jan 1, 1974
185.214
-3.553
-1.88%
jan 1, 1975
181.66
-3.554
-1.92%
jan 1, 1976
178.106
-3.554
-1.96%
jan 1, 1977
174.552
-3.554
-2.0%
jan 1, 1978
170.998
-3.554
-2.04%
jan 1, 1979
167.754
-3.244
-1.9%
jan 1, 1980
164.51
-3.244
-1.93%
jan 1, 1981
161.265
-3.245
-1.97%
jan 1, 1982
158.021
-3.244
-2.01%
jan 1, 1983
154.776
-3.245
-2.05%
jan 1, 1984
151.82
-2.956
-1.91%
jan 1, 1985
148.863
-2.957
-1.95%
jan 1, 1986
145.907
-2.956
-1.99%
jan 1, 1987
142.95
-2.957
-2.03%
jan 1, 1988
139.994
-2.956
-2.07%
jan 1, 1989
137.304
-2.69
-1.92%
jan 1, 1990
134.614
-2.69
-1.96%
jan 1, 1991
131.925
-2.689
-2.0%
jan 1, 1992
129.235
-2.69
-2.04%
jan 1, 1993
126.545
-2.69
-2.08%
jan 1, 1994
124.101
-2.444
-1.93%
jan 1, 1995
121.657
-2.444
-1.97%
jan 1, 1996
119.214
-2.443
-2.01%
jan 1, 1997
116.77
-2.444
-2.05%
jan 1, 1998
114.326
-2.444
-2.09%
jan 1, 1999
112.109
-2.217
-1.94%
jan 1, 2000
109.891
-2.218
-1.98%
jan 1, 2001
107.674
-2.217
-2.02%
jan 1, 2002
105.456
-2.218
-2.06%
jan 1, 2003
103.239
-2.217
-2.1%
jan 1, 2004
101.229
-2.01
-1.95%
jan 1, 2005
99.219
-2.01
-1.99%
jan 1, 2006
97.209
-2.01
-2.03%
jan 1, 2007
95.199
-2.01
-2.07%
jan 1, 2008
93.189
-2.01
-2.11%
jan 1, 2009
90.493
-2.696
-2.89%
jan 1, 2010
87.798
-2.695
-2.98%
jan 1, 2011
85.103
-2.695
-3.07%
jan 1, 2012
82.408
-2.695
-3.17%
jan 1, 2013
79.712
-2.696
-3.27%
jan 1, 2014
77.476
-2.236
-2.81%
jan 1, 2015
75.24
-2.236
-2.89%
Ranking of countries by current statistics by years


Comments: