29
/
en
AIzaSyAYiBZKx7MnpbEhh9jyipgxe19OcubqV5w
April 1, 2024
61856
Upper middle income
UMC
false
2
1
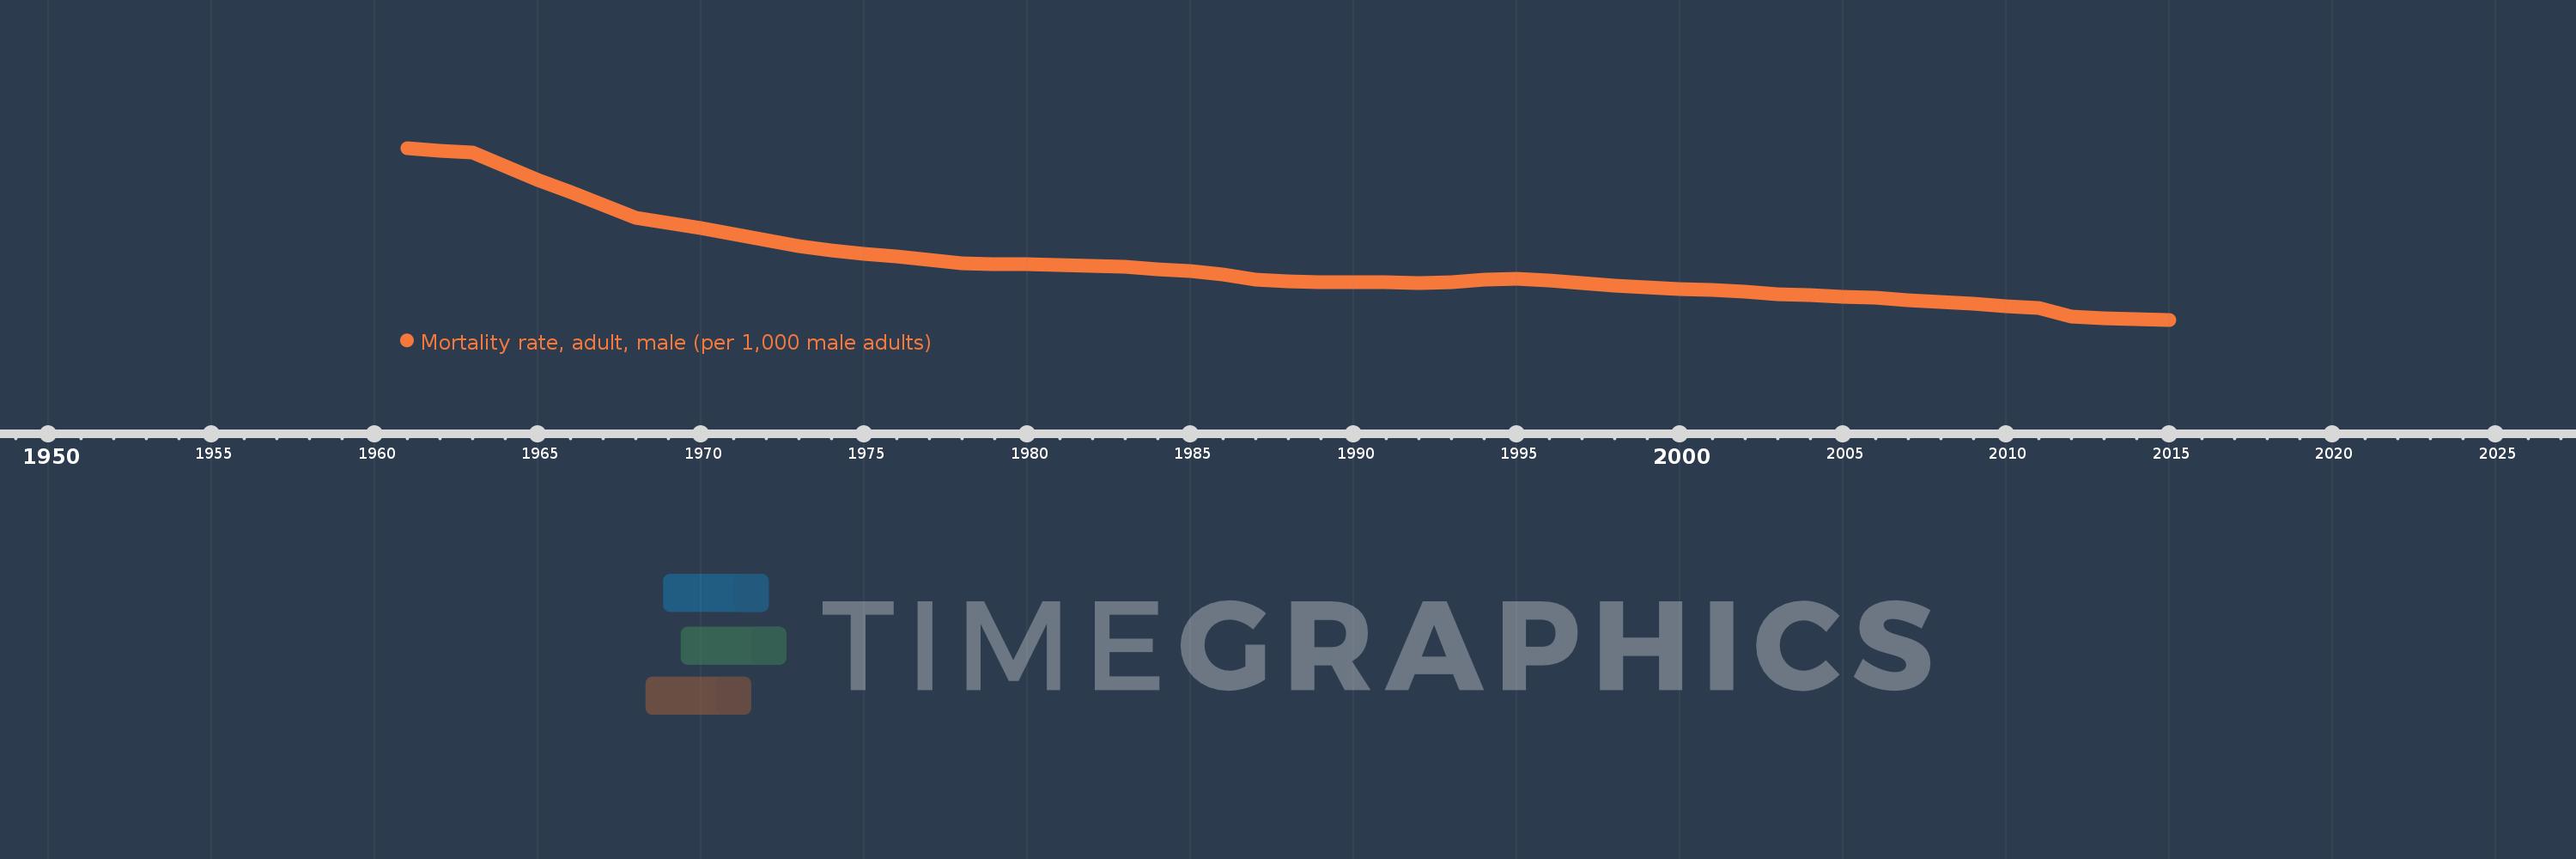
Mortality rate, adult, male (per 1,000 male adults)
2015,2014,2013,2012,2011,2010,2009,2008,2007,2006,2005,2004,2003,2002,2001,2000,1999,1998,1997,1996,1995,1994,1993,1992,1991,1990,1989,1988,1987,1986,1985,1984,1983,1982,1981,1980,1979,1978,1977,1976,1975,1974,1973,1972,1971,1970,1969,1968,1967,1966,1965,1964,1963,1962,1961
This statistics in other country:
AfghanistanAlbaniaAlgeriaAngolaAntigua and BarbudaArab WorldArgentinaArmeniaArubaAustraliaAustriaAzerbaijanBahamas, TheBahrainBangladeshBarbadosBelarusBelgiumBelizeBeninBhutanBoliviaBosnia and HerzegovinaBotswanaBrazilBrunei DarussalamBulgariaBurkina FasoBurundiCabo VerdeCambodiaCameroonCanadaCaribbean small statesCentral African RepublicCentral Europe and the BalticsChadChannel IslandsChileChinaColombiaComorosCongo, Dem. Rep.Congo, Rep.Costa RicaCote d'IvoireCroatiaCubaCuracaoCyprusCzech RepublicDenmarkDjiboutiDominicaDominican RepublicEarly-demographic dividendEast Asia & PacificEast Asia & Pacific (excluding high income)East Asia & Pacific (IDA & IBRD countries)EcuadorEgypt, Arab Rep.El SalvadorEquatorial GuineaEritreaEstoniaEthiopiaEuro areaEurope & Central AsiaEurope & Central Asia (excluding high income)Europe & Central Asia (IDA & IBRD countries)European UnionFijiFinlandFragile and conflict affected situationsFranceFrench PolynesiaGabonGambia, TheGeorgiaGermanyGhanaGreeceGreenlandGrenadaGuamGuatemalaGuineaGuinea-BissauGuyanaHaitiHeavily indebted poor countries (HIPC)High incomeHondurasHong Kong SAR, ChinaHungaryIBRD onlyIcelandIDA & IBRD totalIDA blendIDA onlyIDA totalIndiaIndonesiaIran, Islamic Rep.IraqIrelandIsraelItalyJamaicaJapanJordanKazakhstanKenyaKiribatiKorea, Dem. People’s Rep.Korea, Rep.KuwaitKyrgyz RepublicLao PDRLate-demographic dividendLatin America & Caribbean Latin America & Caribbean (excluding high income)Latin America & the Caribbean (IDA & IBRD countries)LatviaLeast developed countries: UN classificationLebanonLesothoLiberiaLibyaLithuaniaLow & middle incomeLow incomeLower middle incomeLuxembourgMacao SAR, ChinaMacedonia, FYRMadagascarMalawiMalaysiaMaldivesMaliMaltaMarshall IslandsMauritaniaMauritiusMexicoMicronesia, Fed. Sts.Middle East & North AfricaMiddle East & North Africa (excluding high income)Middle East & North Africa (IDA & IBRD countries)Middle incomeMoldovaMongoliaMontenegroMoroccoMozambiqueMyanmarNamibiaNepalNetherlandsNew CaledoniaNew ZealandNicaraguaNigerNigeriaNorth AmericaNorwayOECD membersOmanOther small statesPacific island small statesPakistanPanamaPapua New GuineaParaguayPeruPhilippinesPolandPortugalPost-demographic dividendPre-demographic dividendPuerto RicoQatarRomaniaRussian FederationRwandaSamoaSao Tome and PrincipeSaudi ArabiaSenegalSerbiaSeychellesSierra LeoneSingaporeSlovak RepublicSloveniaSmall statesSolomon IslandsSomaliaSouth AfricaSouth AsiaSouth Asia (IDA & IBRD)South SudanSpainSri LankaSt. Kitts and NevisSt. LuciaSt. Vincent and the GrenadinesSub-Saharan Africa Sub-Saharan Africa (excluding high income)Sub-Saharan Africa (IDA & IBRD countries)SudanSurinameSwazilandSwedenSwitzerlandSyrian Arab RepublicTajikistanTanzaniaThailandTimor-LesteTogoTongaTrinidad and TobagoTunisiaTurkeyTurkmenistanUgandaUkraineUnited Arab EmiratesUnited KingdomUnited StatesUpper middle incomeUruguayUzbekistanVanuatuVenezuela, RBVietnamVirgin Islands (U.S.)West Bank and GazaWorldYemen, Rep.ZambiaZimbabwe Timeline:
This timeline shows a graph from 1961 to 2015 of Upper middle income. No data until 1960. Number of actual observations by date: 55.
Source name:
World Development Indicators
Source organization:
(1) United Nations Population Division. World Population Prospects. New York, United Nations, Department of Economic and Social Affairs (advanced Excel tables). Available at http://esa.un.org/wpp/unpp/panel_population.htm, (2) University of California, Berkeley, and Max Planck Institute for Demographic Research. Human Mortality Database. [ www.mortality.org or www.humanmortality.de].
Categories, topics:
Health, Gender
Last updated:
apr 23, 2017
Indicators value changes by year
Minimum:
134.753
jan 1, 2015
Maximum:
429.694
jan 1, 1961
At the date of observation
Value
Absolute change
Change from previous value
jan 1, 1961
429.694
+429.694
0.0%
jan 1, 1962
425.374
-4.319
-1.01%
jan 1, 1963
421.785
-3.589
-0.84%
jan 1, 1964
398.68
-23.106
-5.48%
jan 1, 1965
375.236
-23.444
-5.88%
jan 1, 1966
353.888
-21.347
-5.69%
jan 1, 1967
332.029
-21.859
-6.18%
jan 1, 1968
310.392
-21.637
-6.52%
jan 1, 1969
300.912
-9.48
-3.05%
jan 1, 1970
291.985
-8.927
-2.97%
jan 1, 1971
281.907
-10.078
-3.45%
jan 1, 1972
271.642
-10.265
-3.64%
jan 1, 1973
260.986
-10.656
-3.92%
jan 1, 1974
254.384
-6.602
-2.53%
jan 1, 1975
248.259
-6.126
-2.41%
jan 1, 1976
242.958
-5.3
-2.14%
jan 1, 1977
236.868
-6.09
-2.51%
jan 1, 1978
231.16
-5.708
-2.41%
jan 1, 1979
230.362
-0.798
-0.35%
jan 1, 1980
230.011
-0.352
-0.15%
jan 1, 1981
229.167
-0.844
-0.37%
jan 1, 1982
227.369
-1.797
-0.78%
jan 1, 1983
225.321
-2.049
-0.9%
jan 1, 1984
221.44
-3.881
-1.72%
jan 1, 1985
218.207
-3.233
-1.46%
jan 1, 1986
211.924
-6.283
-2.88%
jan 1, 1987
203.986
-7.938
-3.75%
jan 1, 1988
199.981
-4.004
-1.96%
jan 1, 1989
199.03
-0.952
-0.48%
jan 1, 1990
199.024
-0.006
0.0%
jan 1, 1991
198.533
-0.491
-0.25%
jan 1, 1992
197.681
-0.852
-0.43%
jan 1, 1993
199.273
+1.593
0.81%
jan 1, 1994
203.437
+4.164
2.09%
jan 1, 1995
204.918
+1.481
0.73%
jan 1, 1996
202.078
-2.84
-1.39%
jan 1, 1997
197.791
-4.286
-2.12%
jan 1, 1998
193.948
-3.843
-1.94%
jan 1, 1999
189.727
-4.222
-2.18%
jan 1, 2000
188.075
-1.651
-0.87%
jan 1, 2001
185.841
-2.234
-1.19%
jan 1, 2002
182.463
-3.378
-1.82%
jan 1, 2003
179.128
-3.335
-1.83%
jan 1, 2004
177.358
-1.77
-0.99%
jan 1, 2005
174.658
-2.7
-1.52%
jan 1, 2006
172.606
-2.052
-1.17%
jan 1, 2007
168.304
-4.302
-2.49%
jan 1, 2008
164.632
-3.672
-2.18%
jan 1, 2009
161.798
-2.834
-1.72%
jan 1, 2010
157.988
-3.81
-2.35%
jan 1, 2011
155.367
-2.621
-1.66%
jan 1, 2012
140.45
-14.917
-9.6%
jan 1, 2013
137.949
-2.501
-1.78%
jan 1, 2014
136.343
-1.606
-1.16%
jan 1, 2015
134.753
-1.59
-1.17%
Ranking of countries by current statistics by years


Comments: