29
/
en
AIzaSyAYiBZKx7MnpbEhh9jyipgxe19OcubqV5w
April 1, 2024
150701
Honduras
HND
true
2
1
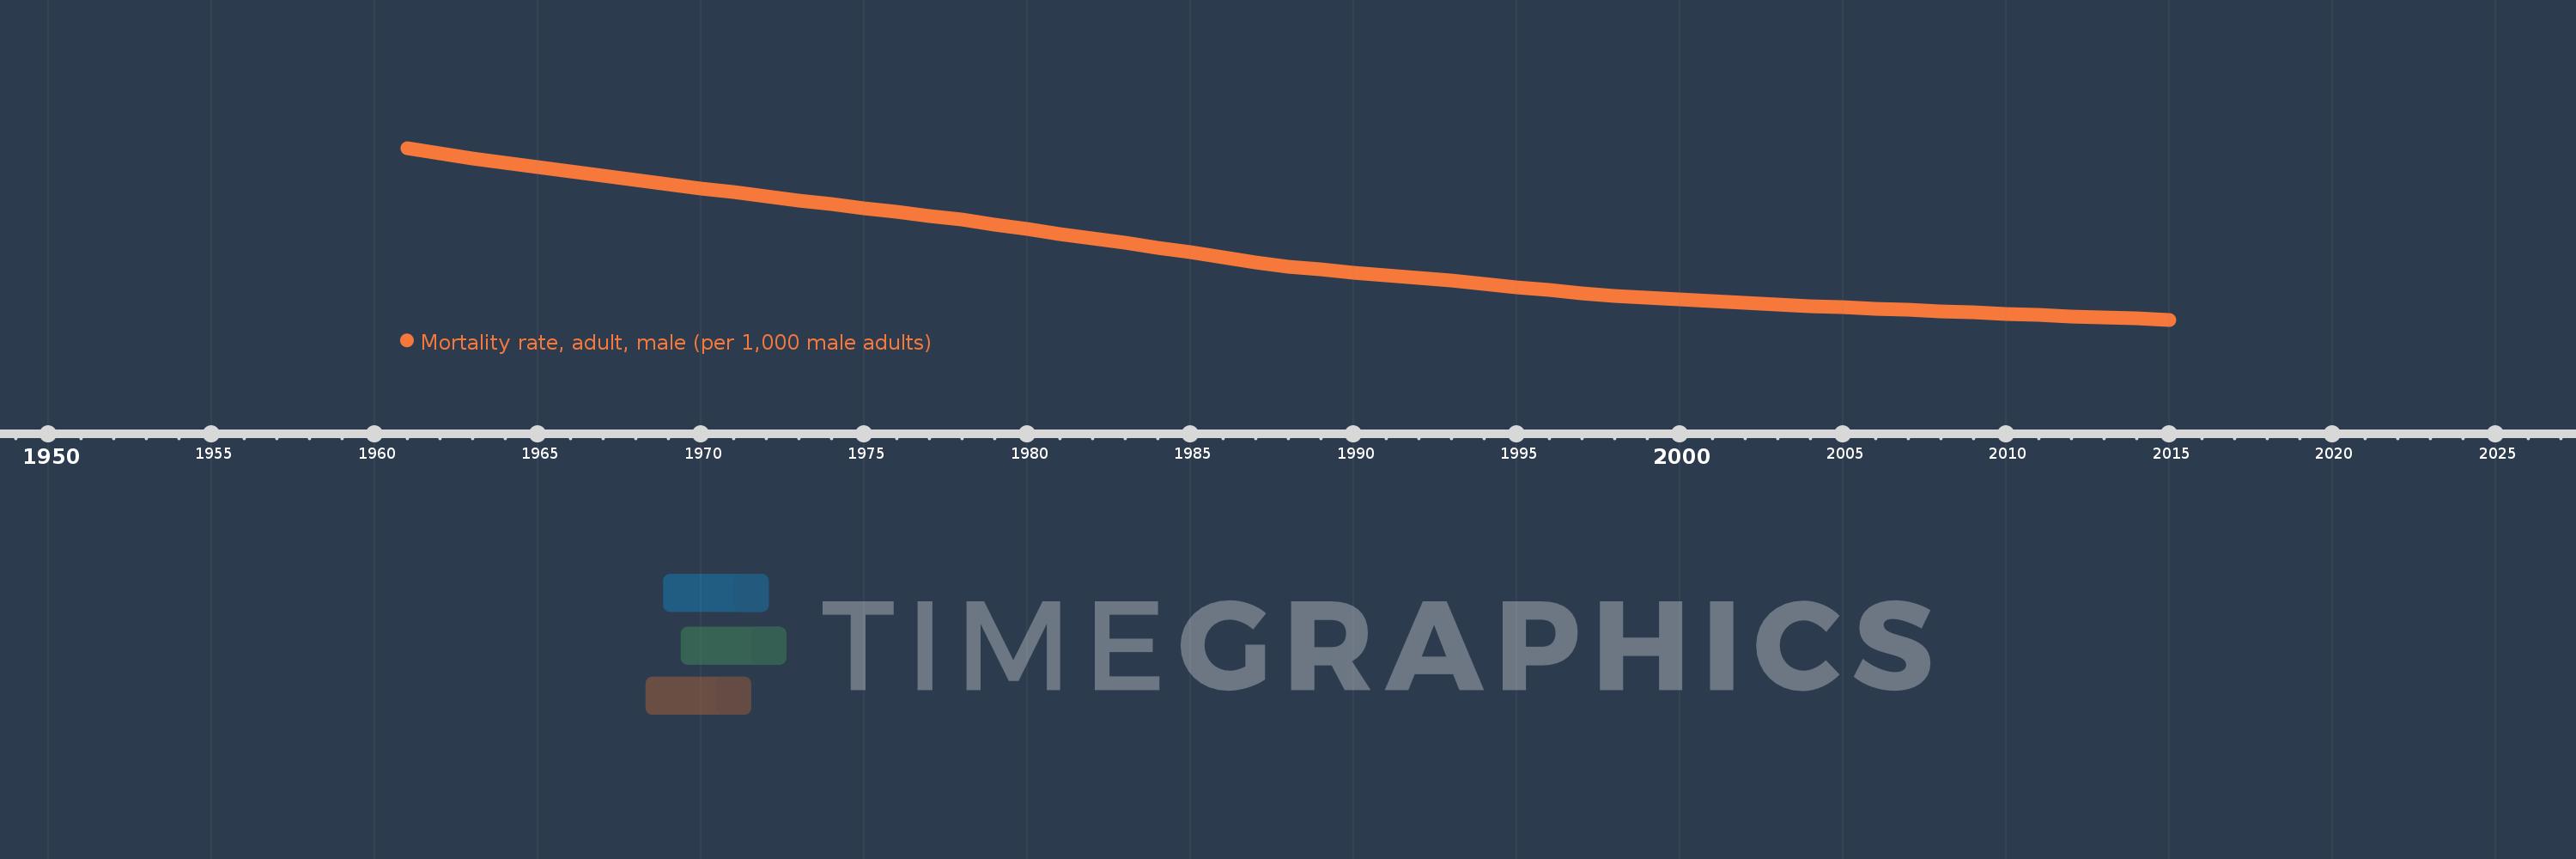
Mortality rate, adult, male (per 1,000 male adults)
2015,2014,2013,2012,2011,2010,2009,2008,2007,2006,2005,2004,2003,2002,2001,2000,1999,1998,1997,1996,1995,1994,1993,1992,1991,1990,1989,1988,1987,1986,1985,1984,1983,1982,1981,1980,1979,1978,1977,1976,1975,1974,1973,1972,1971,1970,1969,1968,1967,1966,1965,1964,1963,1962,1961
This statistics in other country:
AfghanistanAlbaniaAlgeriaAngolaAntigua and BarbudaArab WorldArgentinaArmeniaArubaAustraliaAustriaAzerbaijanBahamas, TheBahrainBangladeshBarbadosBelarusBelgiumBelizeBeninBhutanBoliviaBosnia and HerzegovinaBotswanaBrazilBrunei DarussalamBulgariaBurkina FasoBurundiCabo VerdeCambodiaCameroonCanadaCaribbean small statesCentral African RepublicCentral Europe and the BalticsChadChannel IslandsChileChinaColombiaComorosCongo, Dem. Rep.Congo, Rep.Costa RicaCote d'IvoireCroatiaCubaCuracaoCyprusCzech RepublicDenmarkDjiboutiDominicaDominican RepublicEarly-demographic dividendEast Asia & PacificEast Asia & Pacific (excluding high income)East Asia & Pacific (IDA & IBRD countries)EcuadorEgypt, Arab Rep.El SalvadorEquatorial GuineaEritreaEstoniaEthiopiaEuro areaEurope & Central AsiaEurope & Central Asia (excluding high income)Europe & Central Asia (IDA & IBRD countries)European UnionFijiFinlandFragile and conflict affected situationsFranceFrench PolynesiaGabonGambia, TheGeorgiaGermanyGhanaGreeceGreenlandGrenadaGuamGuatemalaGuineaGuinea-BissauGuyanaHaitiHeavily indebted poor countries (HIPC)High incomeHondurasHong Kong SAR, ChinaHungaryIBRD onlyIcelandIDA & IBRD totalIDA blendIDA onlyIDA totalIndiaIndonesiaIran, Islamic Rep.IraqIrelandIsraelItalyJamaicaJapanJordanKazakhstanKenyaKiribatiKorea, Dem. People’s Rep.Korea, Rep.KuwaitKyrgyz RepublicLao PDRLate-demographic dividendLatin America & Caribbean Latin America & Caribbean (excluding high income)Latin America & the Caribbean (IDA & IBRD countries)LatviaLeast developed countries: UN classificationLebanonLesothoLiberiaLibyaLithuaniaLow & middle incomeLow incomeLower middle incomeLuxembourgMacao SAR, ChinaMacedonia, FYRMadagascarMalawiMalaysiaMaldivesMaliMaltaMarshall IslandsMauritaniaMauritiusMexicoMicronesia, Fed. Sts.Middle East & North AfricaMiddle East & North Africa (excluding high income)Middle East & North Africa (IDA & IBRD countries)Middle incomeMoldovaMongoliaMontenegroMoroccoMozambiqueMyanmarNamibiaNepalNetherlandsNew CaledoniaNew ZealandNicaraguaNigerNigeriaNorth AmericaNorwayOECD membersOmanOther small statesPacific island small statesPakistanPanamaPapua New GuineaParaguayPeruPhilippinesPolandPortugalPost-demographic dividendPre-demographic dividendPuerto RicoQatarRomaniaRussian FederationRwandaSamoaSao Tome and PrincipeSaudi ArabiaSenegalSerbiaSeychellesSierra LeoneSingaporeSlovak RepublicSloveniaSmall statesSolomon IslandsSomaliaSouth AfricaSouth AsiaSouth Asia (IDA & IBRD)South SudanSpainSri LankaSt. Kitts and NevisSt. LuciaSt. Vincent and the GrenadinesSub-Saharan Africa Sub-Saharan Africa (excluding high income)Sub-Saharan Africa (IDA & IBRD countries)SudanSurinameSwazilandSwedenSwitzerlandSyrian Arab RepublicTajikistanTanzaniaThailandTimor-LesteTogoTongaTrinidad and TobagoTunisiaTurkeyTurkmenistanUgandaUkraineUnited Arab EmiratesUnited KingdomUnited StatesUpper middle incomeUruguayUzbekistanVanuatuVenezuela, RBVietnamVirgin Islands (U.S.)West Bank and GazaWorldYemen, Rep.ZambiaZimbabwe Timeline:
This timeline shows a graph from 1961 to 2015 of Honduras. No data until 1960. Number of actual observations by date: 55.
Source name:
World Development Indicators
Source organization:
(1) United Nations Population Division. World Population Prospects. New York, United Nations, Department of Economic and Social Affairs (advanced Excel tables). Available at http://esa.un.org/wpp/unpp/panel_population.htm, (2) University of California, Berkeley, and Max Planck Institute for Demographic Research. Human Mortality Database. [ www.mortality.org or www.humanmortality.de].
Categories, topics:
Health, Gender
Last updated:
apr 23, 2017
Indicators value changes by year
Minimum:
174.134
jan 1, 2015
Maximum:
409.551
jan 1, 1961
At the date of observation
Value
Absolute change
Change from previous value
jan 1, 1961
409.551
+409.551
0.0%
jan 1, 1962
402.187
-7.364
-1.8%
jan 1, 1963
394.822
-7.365
-1.83%
jan 1, 1964
388.992
-5.83
-1.48%
jan 1, 1965
383.162
-5.83
-1.5%
jan 1, 1966
377.332
-5.83
-1.52%
jan 1, 1967
371.502
-5.83
-1.55%
jan 1, 1968
365.672
-5.83
-1.57%
jan 1, 1969
360.05
-5.622
-1.54%
jan 1, 1970
354.429
-5.621
-1.56%
jan 1, 1971
348.808
-5.621
-1.59%
jan 1, 1972
343.187
-5.621
-1.61%
jan 1, 1973
337.566
-5.621
-1.64%
jan 1, 1974
332.303
-5.263
-1.56%
jan 1, 1975
327.041
-5.262
-1.58%
jan 1, 1976
321.779
-5.262
-1.61%
jan 1, 1977
316.516
-5.263
-1.64%
jan 1, 1978
311.254
-5.262
-1.66%
jan 1, 1979
304.857
-6.397
-2.06%
jan 1, 1980
298.461
-6.396
-2.1%
jan 1, 1981
292.064
-6.397
-2.14%
jan 1, 1982
285.668
-6.396
-2.19%
jan 1, 1983
279.272
-6.396
-2.24%
jan 1, 1984
272.742
-6.53
-2.34%
jan 1, 1985
266.213
-6.529
-2.39%
jan 1, 1986
259.683
-6.53
-2.45%
jan 1, 1987
253.154
-6.529
-2.51%
jan 1, 1988
246.624
-6.53
-2.58%
jan 1, 1989
242.806
-3.818
-1.55%
jan 1, 1990
238.988
-3.818
-1.57%
jan 1, 1991
235.17
-3.818
-1.6%
jan 1, 1992
231.352
-3.818
-1.62%
jan 1, 1993
227.533
-3.819
-1.65%
jan 1, 1994
223.298
-4.235
-1.86%
jan 1, 1995
219.063
-4.235
-1.9%
jan 1, 1996
214.827
-4.236
-1.93%
jan 1, 1997
210.592
-4.235
-1.97%
jan 1, 1998
206.357
-4.235
-2.01%
jan 1, 1999
204.072
-2.285
-1.11%
jan 1, 2000
201.788
-2.284
-1.12%
jan 1, 2001
199.504
-2.284
-1.13%
jan 1, 2002
197.22
-2.284
-1.14%
jan 1, 2003
194.935
-2.285
-1.16%
jan 1, 2004
193.111
-1.824
-0.94%
jan 1, 2005
191.286
-1.825
-0.95%
jan 1, 2006
189.461
-1.825
-0.95%
jan 1, 2007
187.637
-1.824
-0.96%
jan 1, 2008
185.812
-1.825
-0.97%
jan 1, 2009
184.052
-1.76
-0.95%
jan 1, 2010
182.292
-1.76
-0.96%
jan 1, 2011
180.532
-1.76
-0.97%
jan 1, 2012
178.772
-1.76
-0.97%
jan 1, 2013
177.012
-1.76
-0.98%
jan 1, 2014
175.573
-1.439
-0.81%
jan 1, 2015
174.134
-1.439
-0.82%
Ranking of countries by current statistics by years


Comments: