29
/
en
AIzaSyAYiBZKx7MnpbEhh9jyipgxe19OcubqV5w
April 1, 2024
184183
Macedonia, FYR
MKD
true
2
1
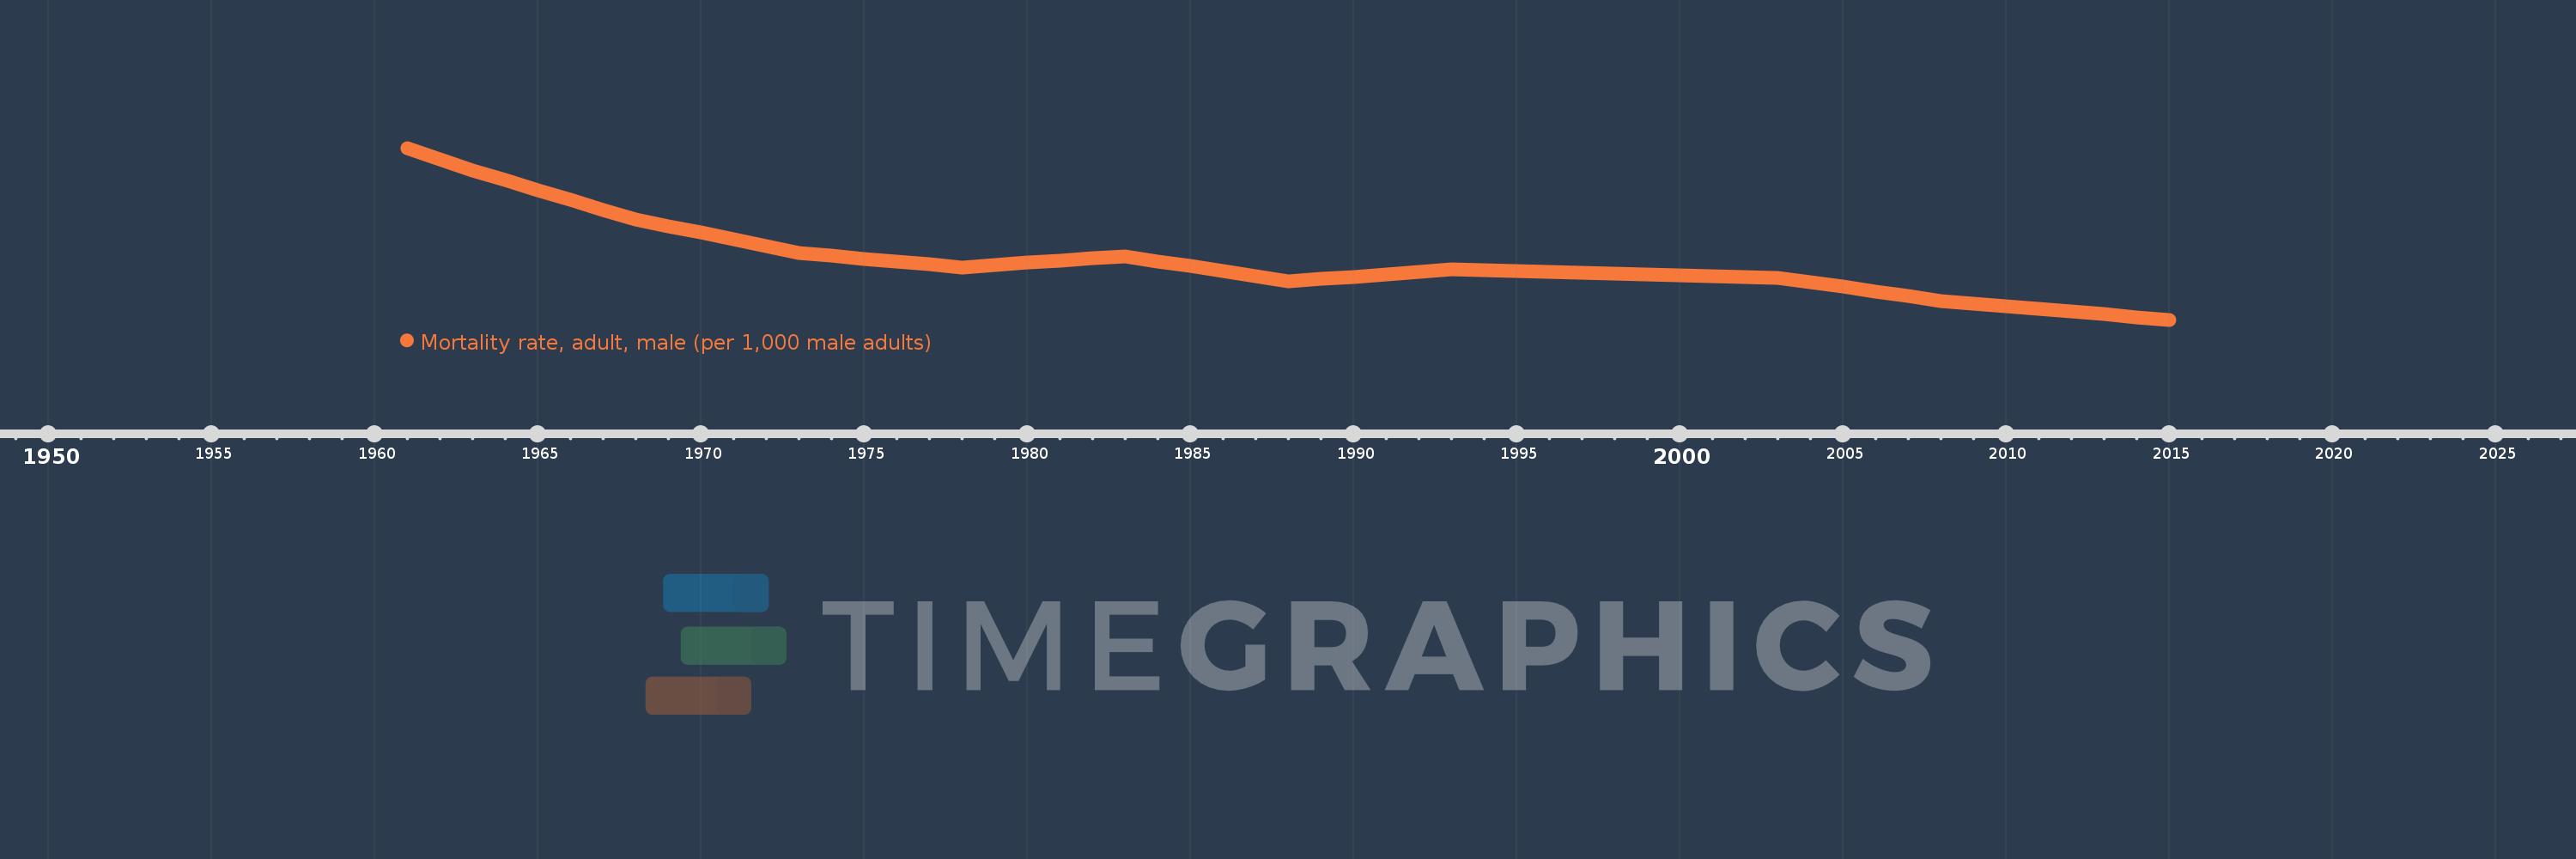
Mortality rate, adult, male (per 1,000 male adults)
2015,2014,2013,2012,2011,2010,2009,2008,2007,2006,2005,2004,2003,2002,2001,2000,1999,1998,1997,1996,1995,1994,1993,1992,1991,1990,1989,1988,1987,1986,1985,1984,1983,1982,1981,1980,1979,1978,1977,1976,1975,1974,1973,1972,1971,1970,1969,1968,1967,1966,1965,1964,1963,1962,1961
This statistics in other country:
AfghanistanAlbaniaAlgeriaAngolaAntigua and BarbudaArab WorldArgentinaArmeniaArubaAustraliaAustriaAzerbaijanBahamas, TheBahrainBangladeshBarbadosBelarusBelgiumBelizeBeninBhutanBoliviaBosnia and HerzegovinaBotswanaBrazilBrunei DarussalamBulgariaBurkina FasoBurundiCabo VerdeCambodiaCameroonCanadaCaribbean small statesCentral African RepublicCentral Europe and the BalticsChadChannel IslandsChileChinaColombiaComorosCongo, Dem. Rep.Congo, Rep.Costa RicaCote d'IvoireCroatiaCubaCuracaoCyprusCzech RepublicDenmarkDjiboutiDominicaDominican RepublicEarly-demographic dividendEast Asia & PacificEast Asia & Pacific (excluding high income)East Asia & Pacific (IDA & IBRD countries)EcuadorEgypt, Arab Rep.El SalvadorEquatorial GuineaEritreaEstoniaEthiopiaEuro areaEurope & Central AsiaEurope & Central Asia (excluding high income)Europe & Central Asia (IDA & IBRD countries)European UnionFijiFinlandFragile and conflict affected situationsFranceFrench PolynesiaGabonGambia, TheGeorgiaGermanyGhanaGreeceGreenlandGrenadaGuamGuatemalaGuineaGuinea-BissauGuyanaHaitiHeavily indebted poor countries (HIPC)High incomeHondurasHong Kong SAR, ChinaHungaryIBRD onlyIcelandIDA & IBRD totalIDA blendIDA onlyIDA totalIndiaIndonesiaIran, Islamic Rep.IraqIrelandIsraelItalyJamaicaJapanJordanKazakhstanKenyaKiribatiKorea, Dem. People’s Rep.Korea, Rep.KuwaitKyrgyz RepublicLao PDRLate-demographic dividendLatin America & Caribbean Latin America & Caribbean (excluding high income)Latin America & the Caribbean (IDA & IBRD countries)LatviaLeast developed countries: UN classificationLebanonLesothoLiberiaLibyaLithuaniaLow & middle incomeLow incomeLower middle incomeLuxembourgMacao SAR, ChinaMacedonia, FYRMadagascarMalawiMalaysiaMaldivesMaliMaltaMarshall IslandsMauritaniaMauritiusMexicoMicronesia, Fed. Sts.Middle East & North AfricaMiddle East & North Africa (excluding high income)Middle East & North Africa (IDA & IBRD countries)Middle incomeMoldovaMongoliaMontenegroMoroccoMozambiqueMyanmarNamibiaNepalNetherlandsNew CaledoniaNew ZealandNicaraguaNigerNigeriaNorth AmericaNorwayOECD membersOmanOther small statesPacific island small statesPakistanPanamaPapua New GuineaParaguayPeruPhilippinesPolandPortugalPost-demographic dividendPre-demographic dividendPuerto RicoQatarRomaniaRussian FederationRwandaSamoaSao Tome and PrincipeSaudi ArabiaSenegalSerbiaSeychellesSierra LeoneSingaporeSlovak RepublicSloveniaSmall statesSolomon IslandsSomaliaSouth AfricaSouth AsiaSouth Asia (IDA & IBRD)South SudanSpainSri LankaSt. Kitts and NevisSt. LuciaSt. Vincent and the GrenadinesSub-Saharan Africa Sub-Saharan Africa (excluding high income)Sub-Saharan Africa (IDA & IBRD countries)SudanSurinameSwazilandSwedenSwitzerlandSyrian Arab RepublicTajikistanTanzaniaThailandTimor-LesteTogoTongaTrinidad and TobagoTunisiaTurkeyTurkmenistanUgandaUkraineUnited Arab EmiratesUnited KingdomUnited StatesUpper middle incomeUruguayUzbekistanVanuatuVenezuela, RBVietnamVirgin Islands (U.S.)West Bank and GazaWorldYemen, Rep.ZambiaZimbabwe Timeline:
This timeline shows a graph from 1961 to 2015 of Macedonia, FYR. No data until 1960. Number of actual observations by date: 55.
Source name:
World Development Indicators
Source organization:
(1) United Nations Population Division. World Population Prospects. New York, United Nations, Department of Economic and Social Affairs (advanced Excel tables). Available at http://esa.un.org/wpp/unpp/panel_population.htm, (2) University of California, Berkeley, and Max Planck Institute for Demographic Research. Human Mortality Database. [ www.mortality.org or www.humanmortality.de].
Categories, topics:
Health, Gender
Last updated:
apr 23, 2017
Indicators value changes by year
Minimum:
134.252
jan 1, 2015
Maximum:
235.094
jan 1, 1961
At the date of observation
Value
Absolute change
Change from previous value
jan 1, 1961
235.094
+235.094
0.0%
jan 1, 1962
228.435
-6.659
-2.83%
jan 1, 1963
221.777
-6.658
-2.91%
jan 1, 1964
216.046
-5.731
-2.58%
jan 1, 1965
210.316
-5.73
-2.65%
jan 1, 1966
204.585
-5.731
-2.72%
jan 1, 1967
198.854
-5.731
-2.8%
jan 1, 1968
193.123
-5.731
-2.88%
jan 1, 1969
189.207
-3.916
-2.03%
jan 1, 1970
185.29
-3.917
-2.07%
jan 1, 1971
181.374
-3.916
-2.11%
jan 1, 1972
177.457
-3.917
-2.16%
jan 1, 1973
173.541
-3.916
-2.21%
jan 1, 1974
171.842
-1.699
-0.98%
jan 1, 1975
170.144
-1.698
-0.99%
jan 1, 1976
168.445
-1.699
-1.0%
jan 1, 1977
166.747
-1.698
-1.01%
jan 1, 1978
165.048
-1.699
-1.02%
jan 1, 1979
166.358
+1.31
0.79%
jan 1, 1980
167.668
+1.31
0.79%
jan 1, 1981
168.978
+1.31
0.78%
jan 1, 1982
170.288
+1.31
0.78%
jan 1, 1983
171.598
+1.31
0.77%
jan 1, 1984
168.617
-2.981
-1.74%
jan 1, 1985
165.637
-2.98
-1.77%
jan 1, 1986
162.656
-2.981
-1.8%
jan 1, 1987
159.675
-2.981
-1.83%
jan 1, 1988
156.695
-2.98
-1.87%
jan 1, 1989
158.079
+1.384
0.88%
jan 1, 1990
159.463
+1.384
0.88%
jan 1, 1991
160.847
+1.384
0.87%
jan 1, 1992
162.231
+1.384
0.86%
jan 1, 1993
163.616
+1.385
0.85%
jan 1, 1994
163.153
-0.463
-0.28%
jan 1, 1995
162.691
-0.462
-0.28%
jan 1, 1996
162.229
-0.462
-0.28%
jan 1, 1997
161.767
-0.462
-0.28%
jan 1, 1998
161.305
-0.462
-0.29%
jan 1, 1999
160.843
-0.462
-0.29%
jan 1, 2000
160.381
-0.462
-0.29%
jan 1, 2001
159.919
-0.462
-0.29%
jan 1, 2002
159.457
-0.462
-0.29%
jan 1, 2003
158.996
-0.461
-0.29%
jan 1, 2004
156.276
-2.72
-1.71%
jan 1, 2005
153.556
-2.72
-1.74%
jan 1, 2006
150.836
-2.72
-1.77%
jan 1, 2007
148.116
-2.72
-1.8%
jan 1, 2008
145.396
-2.72
-1.84%
jan 1, 2009
143.796
-1.6
-1.1%
jan 1, 2010
142.195
-1.601
-1.11%
jan 1, 2011
140.594
-1.601
-1.13%
jan 1, 2012
138.993
-1.601
-1.14%
jan 1, 2013
137.392
-1.601
-1.15%
jan 1, 2014
135.822
-1.57
-1.14%
jan 1, 2015
134.252
-1.57
-1.16%
Ranking of countries by current statistics by years


Comments: