29
/
en
AIzaSyAYiBZKx7MnpbEhh9jyipgxe19OcubqV5w
April 1, 2024
263747
Timor-Leste
TLS
true
2
1
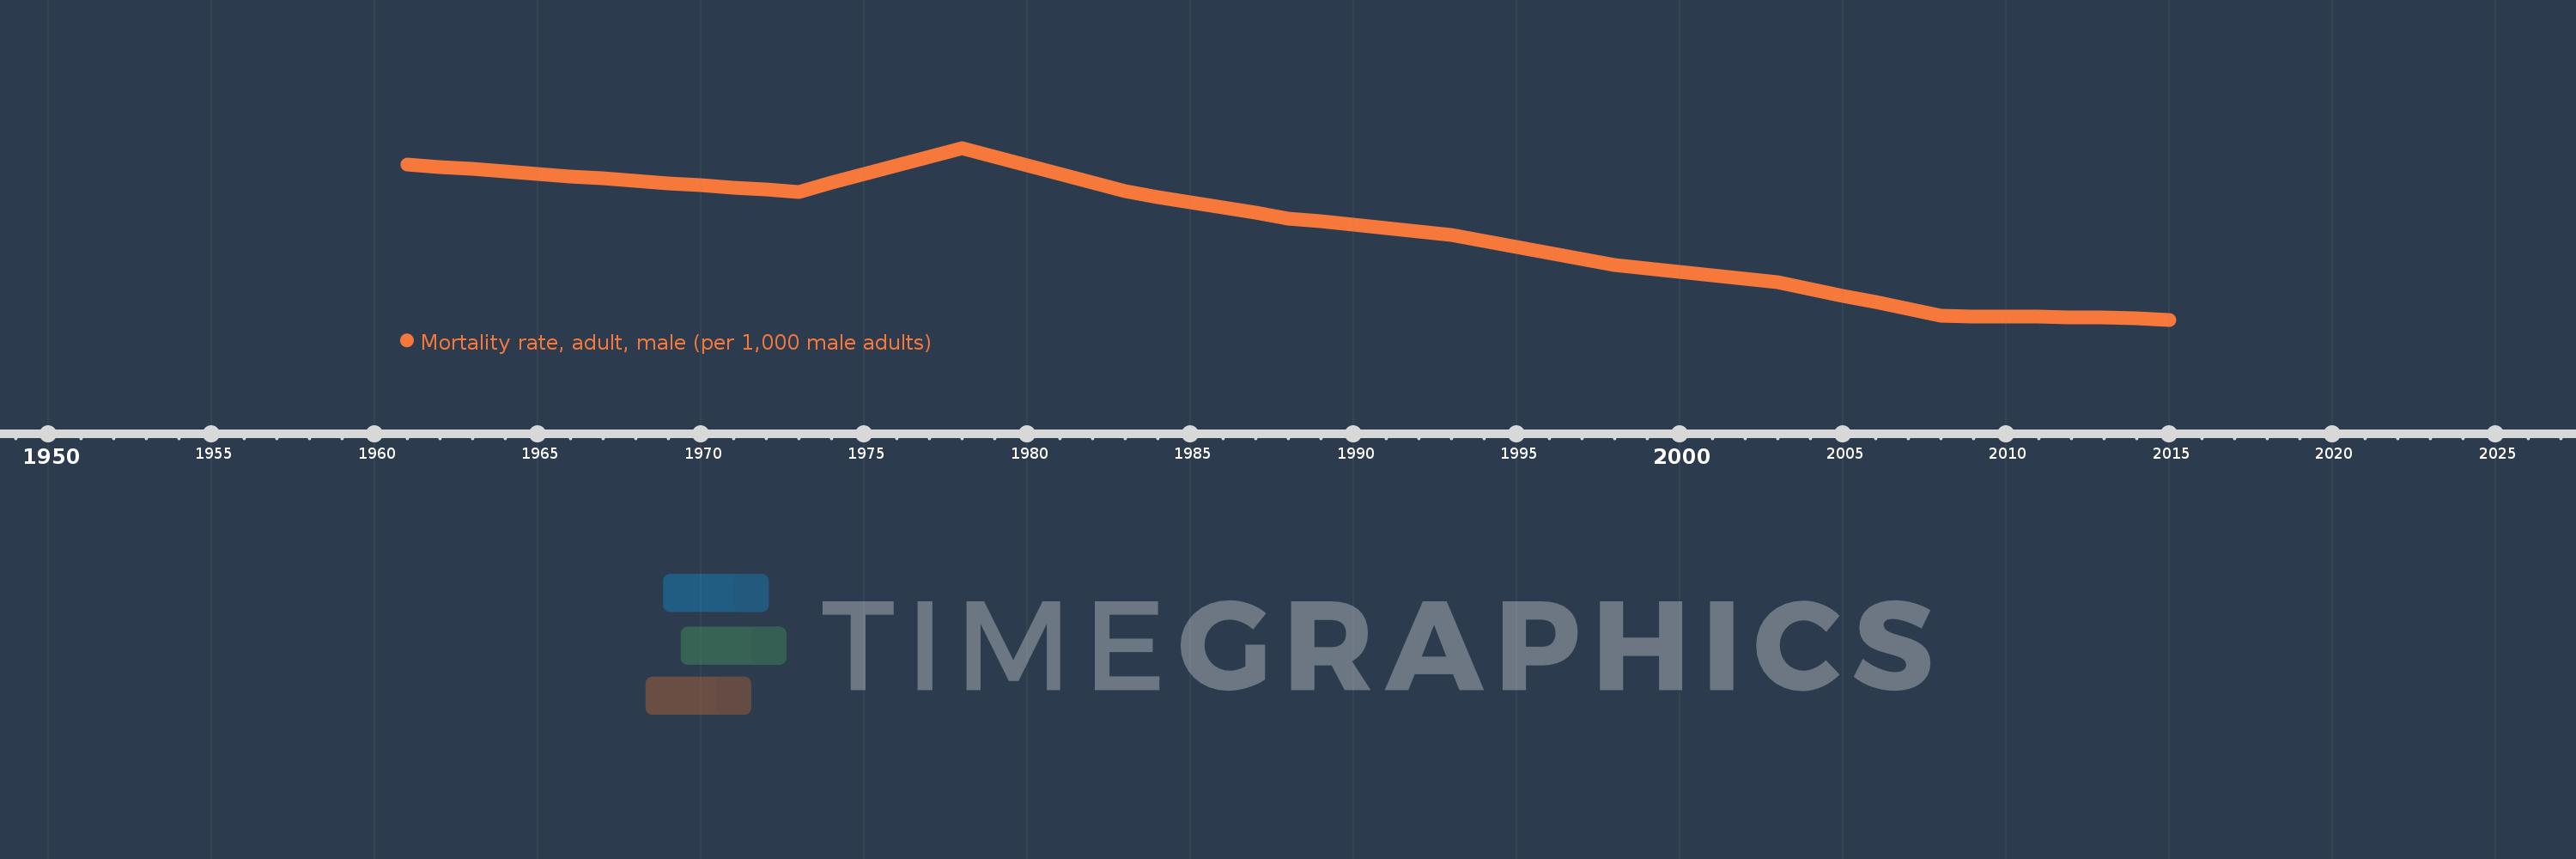
Mortality rate, adult, male (per 1,000 male adults)
2015,2014,2013,2012,2011,2010,2009,2008,2007,2006,2005,2004,2003,2002,2001,2000,1999,1998,1997,1996,1995,1994,1993,1992,1991,1990,1989,1988,1987,1986,1985,1984,1983,1982,1981,1980,1979,1978,1977,1976,1975,1974,1973,1972,1971,1970,1969,1968,1967,1966,1965,1964,1963,1962,1961
This statistics in other country:
AfghanistanAlbaniaAlgeriaAngolaAntigua and BarbudaArab WorldArgentinaArmeniaArubaAustraliaAustriaAzerbaijanBahamas, TheBahrainBangladeshBarbadosBelarusBelgiumBelizeBeninBhutanBoliviaBosnia and HerzegovinaBotswanaBrazilBrunei DarussalamBulgariaBurkina FasoBurundiCabo VerdeCambodiaCameroonCanadaCaribbean small statesCentral African RepublicCentral Europe and the BalticsChadChannel IslandsChileChinaColombiaComorosCongo, Dem. Rep.Congo, Rep.Costa RicaCote d'IvoireCroatiaCubaCuracaoCyprusCzech RepublicDenmarkDjiboutiDominicaDominican RepublicEarly-demographic dividendEast Asia & PacificEast Asia & Pacific (excluding high income)East Asia & Pacific (IDA & IBRD countries)EcuadorEgypt, Arab Rep.El SalvadorEquatorial GuineaEritreaEstoniaEthiopiaEuro areaEurope & Central AsiaEurope & Central Asia (excluding high income)Europe & Central Asia (IDA & IBRD countries)European UnionFijiFinlandFragile and conflict affected situationsFranceFrench PolynesiaGabonGambia, TheGeorgiaGermanyGhanaGreeceGreenlandGrenadaGuamGuatemalaGuineaGuinea-BissauGuyanaHaitiHeavily indebted poor countries (HIPC)High incomeHondurasHong Kong SAR, ChinaHungaryIBRD onlyIcelandIDA & IBRD totalIDA blendIDA onlyIDA totalIndiaIndonesiaIran, Islamic Rep.IraqIrelandIsraelItalyJamaicaJapanJordanKazakhstanKenyaKiribatiKorea, Dem. People’s Rep.Korea, Rep.KuwaitKyrgyz RepublicLao PDRLate-demographic dividendLatin America & Caribbean Latin America & Caribbean (excluding high income)Latin America & the Caribbean (IDA & IBRD countries)LatviaLeast developed countries: UN classificationLebanonLesothoLiberiaLibyaLithuaniaLow & middle incomeLow incomeLower middle incomeLuxembourgMacao SAR, ChinaMacedonia, FYRMadagascarMalawiMalaysiaMaldivesMaliMaltaMarshall IslandsMauritaniaMauritiusMexicoMicronesia, Fed. Sts.Middle East & North AfricaMiddle East & North Africa (excluding high income)Middle East & North Africa (IDA & IBRD countries)Middle incomeMoldovaMongoliaMontenegroMoroccoMozambiqueMyanmarNamibiaNepalNetherlandsNew CaledoniaNew ZealandNicaraguaNigerNigeriaNorth AmericaNorwayOECD membersOmanOther small statesPacific island small statesPakistanPanamaPapua New GuineaParaguayPeruPhilippinesPolandPortugalPost-demographic dividendPre-demographic dividendPuerto RicoQatarRomaniaRussian FederationRwandaSamoaSao Tome and PrincipeSaudi ArabiaSenegalSerbiaSeychellesSierra LeoneSingaporeSlovak RepublicSloveniaSmall statesSolomon IslandsSomaliaSouth AfricaSouth AsiaSouth Asia (IDA & IBRD)South SudanSpainSri LankaSt. Kitts and NevisSt. LuciaSt. Vincent and the GrenadinesSub-Saharan Africa Sub-Saharan Africa (excluding high income)Sub-Saharan Africa (IDA & IBRD countries)SudanSurinameSwazilandSwedenSwitzerlandSyrian Arab RepublicTajikistanTanzaniaThailandTimor-LesteTogoTongaTrinidad and TobagoTunisiaTurkeyTurkmenistanUgandaUkraineUnited Arab EmiratesUnited KingdomUnited StatesUpper middle incomeUruguayUzbekistanVanuatuVenezuela, RBVietnamVirgin Islands (U.S.)West Bank and GazaWorldYemen, Rep.ZambiaZimbabwe Timeline:
This timeline shows a graph from 1961 to 2015 of Timor-Leste. No data until 1960. Number of actual observations by date: 55.
Source name:
World Development Indicators
Source organization:
(1) United Nations Population Division. World Population Prospects. New York, United Nations, Department of Economic and Social Affairs (advanced Excel tables). Available at http://esa.un.org/wpp/unpp/panel_population.htm, (2) University of California, Berkeley, and Max Planck Institute for Demographic Research. Human Mortality Database. [ www.mortality.org or www.humanmortality.de].
Categories, topics:
Health, Gender
Last updated:
apr 23, 2017
Indicators value changes by year
Minimum:
174.364
jan 1, 2015
Maximum:
627.158
jan 1, 1978
At the date of observation
Value
Absolute change
Change from previous value
jan 1, 1961
583.85
+583.85
0.0%
jan 1, 1962
577.61
-6.24
-1.07%
jan 1, 1963
571.37
-6.24
-1.08%
jan 1, 1964
565.189
-6.181
-1.08%
jan 1, 1965
559.007
-6.182
-1.09%
jan 1, 1966
552.826
-6.181
-1.11%
jan 1, 1967
546.645
-6.181
-1.12%
jan 1, 1968
540.464
-6.181
-1.13%
jan 1, 1969
534.716
-5.748
-1.06%
jan 1, 1970
528.969
-5.747
-1.07%
jan 1, 1971
523.221
-5.748
-1.09%
jan 1, 1972
517.474
-5.747
-1.1%
jan 1, 1973
511.727
-5.747
-1.11%
jan 1, 1974
534.813
+23.086
4.51%
jan 1, 1975
557.899
+23.086
4.32%
jan 1, 1976
580.986
+23.087
4.14%
jan 1, 1977
604.072
+23.086
3.97%
jan 1, 1978
627.158
+23.086
3.82%
jan 1, 1979
604.17
-22.988
-3.67%
jan 1, 1980
581.182
-22.988
-3.8%
jan 1, 1981
558.194
-22.988
-3.96%
jan 1, 1982
535.206
-22.988
-4.12%
jan 1, 1983
512.218
-22.988
-4.3%
jan 1, 1984
498.147
-14.071
-2.75%
jan 1, 1985
484.075
-14.072
-2.82%
jan 1, 1986
470.003
-14.072
-2.91%
jan 1, 1987
455.932
-14.071
-2.99%
jan 1, 1988
441.86
-14.072
-3.09%
jan 1, 1989
433.071
-8.789
-1.99%
jan 1, 1990
424.282
-8.789
-2.03%
jan 1, 1991
415.493
-8.789
-2.07%
jan 1, 1992
406.704
-8.789
-2.12%
jan 1, 1993
397.915
-8.789
-2.16%
jan 1, 1994
382.175
-15.74
-3.96%
jan 1, 1995
366.435
-15.74
-4.12%
jan 1, 1996
350.695
-15.74
-4.3%
jan 1, 1997
334.955
-15.74
-4.49%
jan 1, 1998
319.215
-15.74
-4.7%
jan 1, 1999
310.08
-9.135
-2.86%
jan 1, 2000
300.944
-9.136
-2.95%
jan 1, 2001
291.808
-9.136
-3.04%
jan 1, 2002
282.673
-9.135
-3.13%
jan 1, 2003
273.537
-9.136
-3.23%
jan 1, 2004
255.735
-17.802
-6.51%
jan 1, 2005
237.933
-17.802
-6.96%
jan 1, 2006
220.132
-17.801
-7.48%
jan 1, 2007
202.33
-17.802
-8.09%
jan 1, 2008
184.528
-17.802
-8.8%
jan 1, 2009
183.758
-0.77
-0.42%
jan 1, 2010
182.988
-0.77
-0.42%
jan 1, 2011
182.219
-0.769
-0.42%
jan 1, 2012
181.449
-0.77
-0.42%
jan 1, 2013
180.679
-0.77
-0.42%
jan 1, 2014
177.521
-3.158
-1.75%
jan 1, 2015
174.364
-3.157
-1.78%
Ranking of countries by current statistics by years


Comments: