29
/
en
AIzaSyAYiBZKx7MnpbEhh9jyipgxe19OcubqV5w
April 1, 2024
228806
Romania
ROU
true
2
1
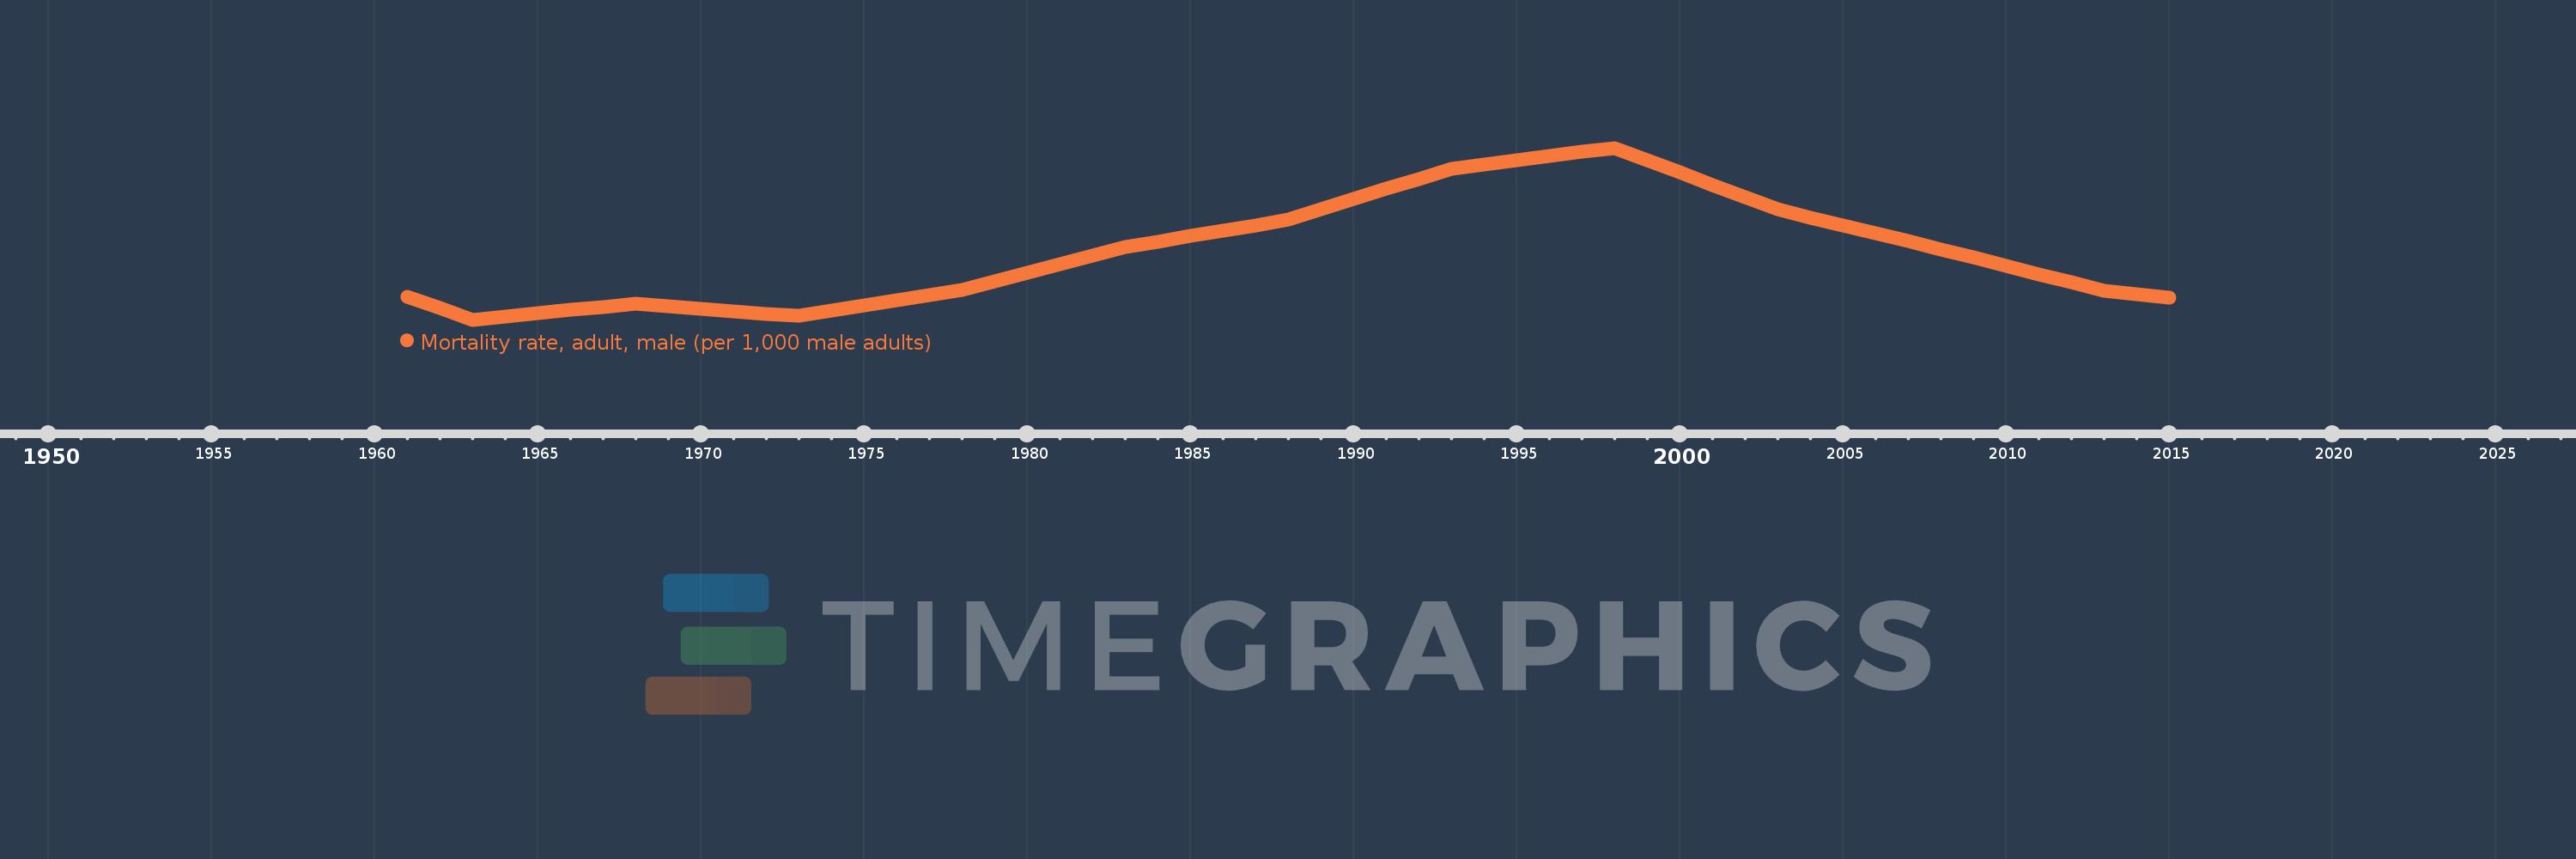
Mortality rate, adult, male (per 1,000 male adults)
2015,2014,2013,2012,2011,2010,2009,2008,2007,2006,2005,2004,2003,2002,2001,2000,1999,1998,1997,1996,1995,1994,1993,1992,1991,1990,1989,1988,1987,1986,1985,1984,1983,1982,1981,1980,1979,1978,1977,1976,1975,1974,1973,1972,1971,1970,1969,1968,1967,1966,1965,1964,1963,1962,1961
This statistics in other country:
AfghanistanAlbaniaAlgeriaAngolaAntigua and BarbudaArab WorldArgentinaArmeniaArubaAustraliaAustriaAzerbaijanBahamas, TheBahrainBangladeshBarbadosBelarusBelgiumBelizeBeninBhutanBoliviaBosnia and HerzegovinaBotswanaBrazilBrunei DarussalamBulgariaBurkina FasoBurundiCabo VerdeCambodiaCameroonCanadaCaribbean small statesCentral African RepublicCentral Europe and the BalticsChadChannel IslandsChileChinaColombiaComorosCongo, Dem. Rep.Congo, Rep.Costa RicaCote d'IvoireCroatiaCubaCuracaoCyprusCzech RepublicDenmarkDjiboutiDominicaDominican RepublicEarly-demographic dividendEast Asia & PacificEast Asia & Pacific (excluding high income)East Asia & Pacific (IDA & IBRD countries)EcuadorEgypt, Arab Rep.El SalvadorEquatorial GuineaEritreaEstoniaEthiopiaEuro areaEurope & Central AsiaEurope & Central Asia (excluding high income)Europe & Central Asia (IDA & IBRD countries)European UnionFijiFinlandFragile and conflict affected situationsFranceFrench PolynesiaGabonGambia, TheGeorgiaGermanyGhanaGreeceGreenlandGrenadaGuamGuatemalaGuineaGuinea-BissauGuyanaHaitiHeavily indebted poor countries (HIPC)High incomeHondurasHong Kong SAR, ChinaHungaryIBRD onlyIcelandIDA & IBRD totalIDA blendIDA onlyIDA totalIndiaIndonesiaIran, Islamic Rep.IraqIrelandIsraelItalyJamaicaJapanJordanKazakhstanKenyaKiribatiKorea, Dem. People’s Rep.Korea, Rep.KuwaitKyrgyz RepublicLao PDRLate-demographic dividendLatin America & Caribbean Latin America & Caribbean (excluding high income)Latin America & the Caribbean (IDA & IBRD countries)LatviaLeast developed countries: UN classificationLebanonLesothoLiberiaLibyaLithuaniaLow & middle incomeLow incomeLower middle incomeLuxembourgMacao SAR, ChinaMacedonia, FYRMadagascarMalawiMalaysiaMaldivesMaliMaltaMarshall IslandsMauritaniaMauritiusMexicoMicronesia, Fed. Sts.Middle East & North AfricaMiddle East & North Africa (excluding high income)Middle East & North Africa (IDA & IBRD countries)Middle incomeMoldovaMongoliaMontenegroMoroccoMozambiqueMyanmarNamibiaNepalNetherlandsNew CaledoniaNew ZealandNicaraguaNigerNigeriaNorth AmericaNorwayOECD membersOmanOther small statesPacific island small statesPakistanPanamaPapua New GuineaParaguayPeruPhilippinesPolandPortugalPost-demographic dividendPre-demographic dividendPuerto RicoQatarRomaniaRussian FederationRwandaSamoaSao Tome and PrincipeSaudi ArabiaSenegalSerbiaSeychellesSierra LeoneSingaporeSlovak RepublicSloveniaSmall statesSolomon IslandsSomaliaSouth AfricaSouth AsiaSouth Asia (IDA & IBRD)South SudanSpainSri LankaSt. Kitts and NevisSt. LuciaSt. Vincent and the GrenadinesSub-Saharan Africa Sub-Saharan Africa (excluding high income)Sub-Saharan Africa (IDA & IBRD countries)SudanSurinameSwazilandSwedenSwitzerlandSyrian Arab RepublicTajikistanTanzaniaThailandTimor-LesteTogoTongaTrinidad and TobagoTunisiaTurkeyTurkmenistanUgandaUkraineUnited Arab EmiratesUnited KingdomUnited StatesUpper middle incomeUruguayUzbekistanVanuatuVenezuela, RBVietnamVirgin Islands (U.S.)West Bank and GazaWorldYemen, Rep.ZambiaZimbabwe Timeline:
This timeline shows a graph from 1961 to 2015 of Romania. No data until 1960. Number of actual observations by date: 55.
Source name:
World Development Indicators
Source organization:
(1) United Nations Population Division. World Population Prospects. New York, United Nations, Department of Economic and Social Affairs (advanced Excel tables). Available at http://esa.un.org/wpp/unpp/panel_population.htm, (2) University of California, Berkeley, and Max Planck Institute for Demographic Research. Human Mortality Database. [ www.mortality.org or www.humanmortality.de].
Categories, topics:
Health, Gender
Last updated:
apr 23, 2017
Indicators value changes by year
Minimum:
184.469
jan 1, 1963
Maximum:
269.02
jan 1, 1998
At the date of observation
Value
Absolute change
Change from previous value
jan 1, 1961
195.767
+195.767
0.0%
jan 1, 1962
190.118
-5.649
-2.89%
jan 1, 1963
184.469
-5.649
-2.97%
jan 1, 1964
186.055
+1.586
0.86%
jan 1, 1965
187.64
+1.585
0.85%
jan 1, 1966
189.225
+1.585
0.84%
jan 1, 1967
190.81
+1.585
0.84%
jan 1, 1968
192.395
+1.585
0.83%
jan 1, 1969
191.166
-1.229
-0.64%
jan 1, 1970
189.937
-1.229
-0.64%
jan 1, 1971
188.707
-1.23
-0.65%
jan 1, 1972
187.478
-1.229
-0.65%
jan 1, 1973
186.249
-1.229
-0.66%
jan 1, 1974
188.868
+2.619
1.41%
jan 1, 1975
191.486
+2.618
1.39%
jan 1, 1976
194.105
+2.619
1.37%
jan 1, 1977
196.724
+2.619
1.35%
jan 1, 1978
199.343
+2.619
1.33%
jan 1, 1979
203.534
+4.191
2.1%
jan 1, 1980
207.725
+4.191
2.06%
jan 1, 1981
211.916
+4.191
2.02%
jan 1, 1982
216.107
+4.191
1.98%
jan 1, 1983
220.298
+4.191
1.94%
jan 1, 1984
222.975
+2.677
1.22%
jan 1, 1985
225.652
+2.677
1.2%
jan 1, 1986
228.328
+2.676
1.19%
jan 1, 1987
231.005
+2.677
1.17%
jan 1, 1988
233.681
+2.676
1.16%
jan 1, 1989
238.726
+5.045
2.16%
jan 1, 1990
243.771
+5.045
2.11%
jan 1, 1991
248.816
+5.045
2.07%
jan 1, 1992
253.861
+5.045
2.03%
jan 1, 1993
258.905
+5.044
1.99%
jan 1, 1994
260.928
+2.023
0.78%
jan 1, 1995
262.951
+2.023
0.78%
jan 1, 1996
264.974
+2.023
0.77%
jan 1, 1997
266.997
+2.023
0.76%
jan 1, 1998
269.02
+2.023
0.76%
jan 1, 1999
262.959
-6.061
-2.25%
jan 1, 2000
256.899
-6.06
-2.3%
jan 1, 2001
250.838
-6.061
-2.36%
jan 1, 2002
244.777
-6.061
-2.42%
jan 1, 2003
238.717
-6.06
-2.48%
jan 1, 2004
234.802
-3.915
-1.64%
jan 1, 2005
230.887
-3.915
-1.67%
jan 1, 2006
226.972
-3.915
-1.7%
jan 1, 2007
223.057
-3.915
-1.72%
jan 1, 2008
219.142
-3.915
-1.76%
jan 1, 2009
215.076
-4.066
-1.86%
jan 1, 2010
211.009
-4.067
-1.89%
jan 1, 2011
206.942
-4.067
-1.93%
jan 1, 2012
202.875
-4.067
-1.97%
jan 1, 2013
198.808
-4.067
-2.0%
jan 1, 2014
197.06
-1.748
-0.88%
jan 1, 2015
195.312
-1.748
-0.89%
Ranking of countries by current statistics by years


Comments: