29
/
en
AIzaSyAYiBZKx7MnpbEhh9jyipgxe19OcubqV5w
April 1, 2024
100229
Cameroon
CMR
true
2
1
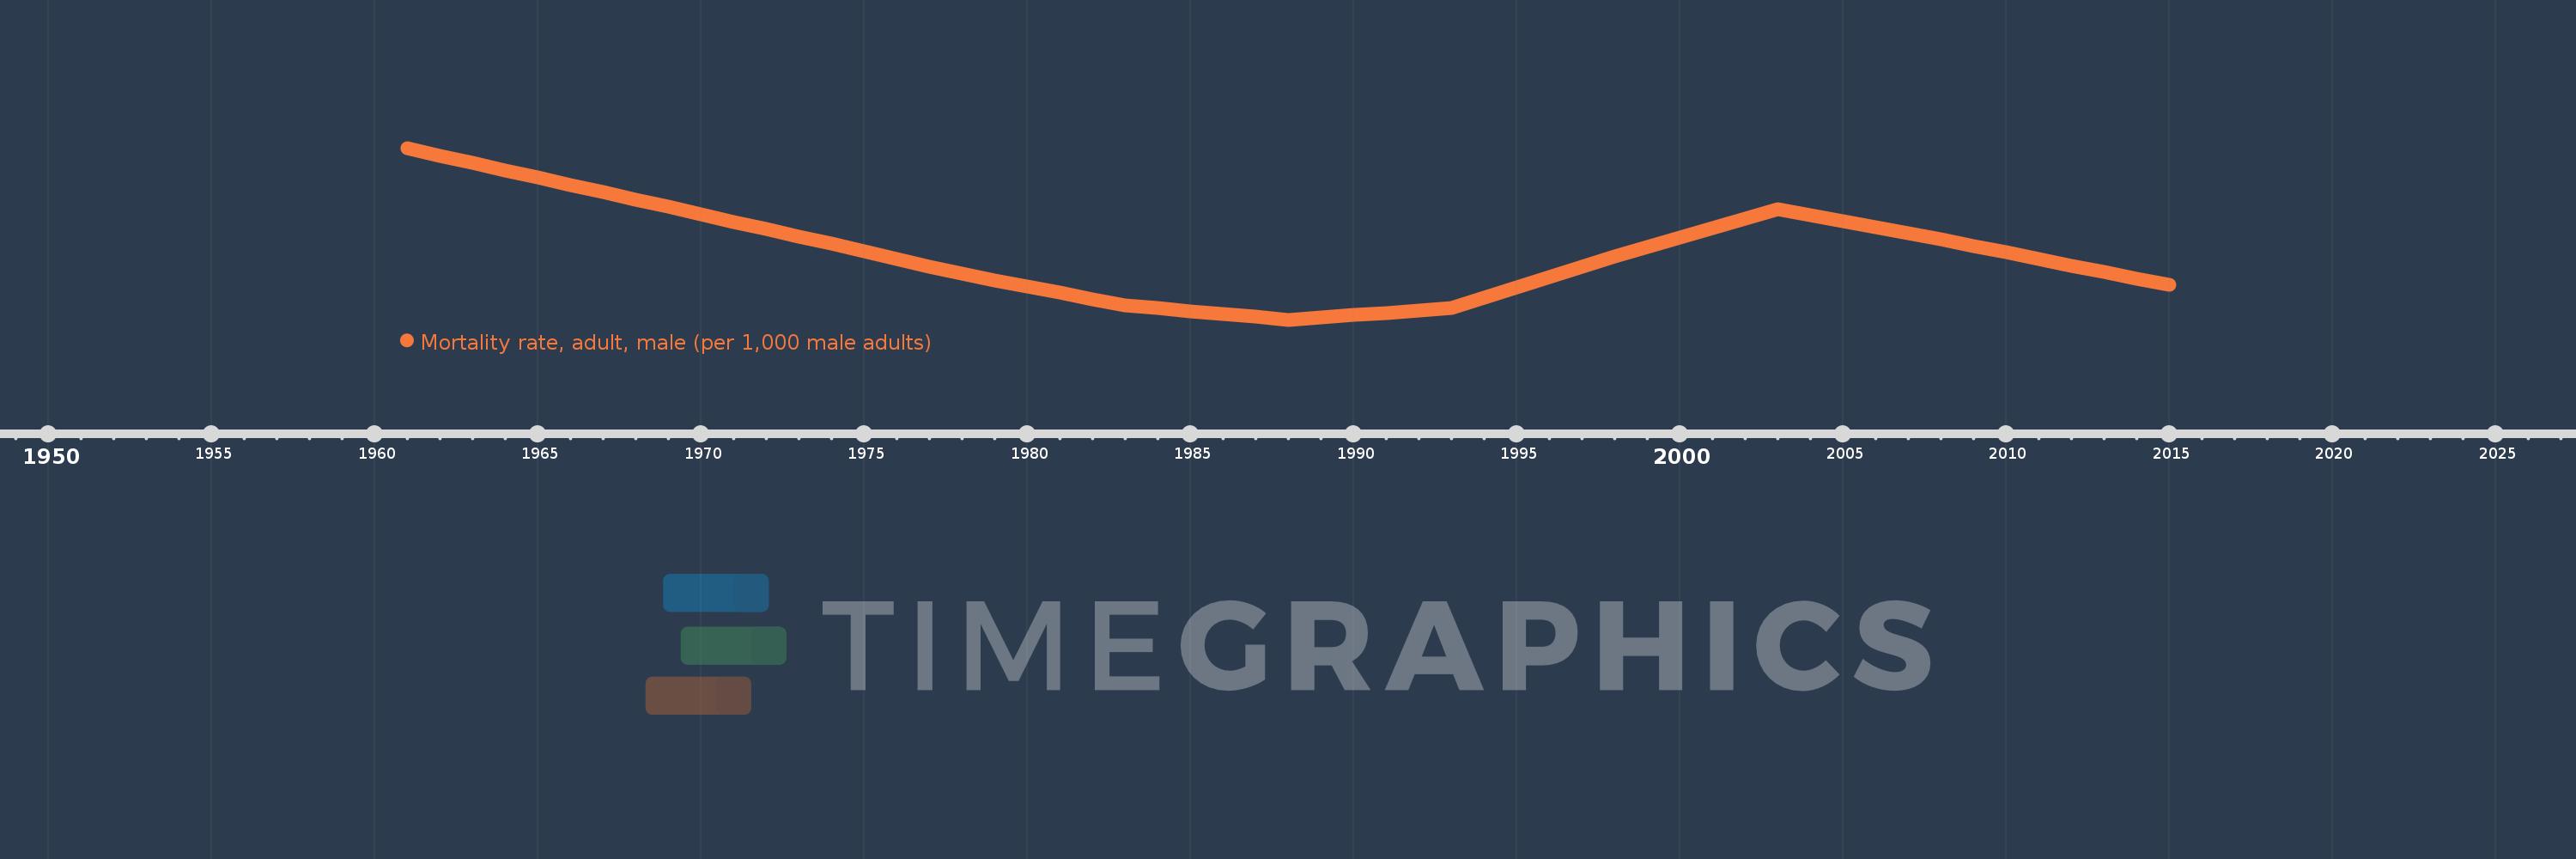
Mortality rate, adult, male (per 1,000 male adults)
2015,2014,2013,2012,2011,2010,2009,2008,2007,2006,2005,2004,2003,2002,2001,2000,1999,1998,1997,1996,1995,1994,1993,1992,1991,1990,1989,1988,1987,1986,1985,1984,1983,1982,1981,1980,1979,1978,1977,1976,1975,1974,1973,1972,1971,1970,1969,1968,1967,1966,1965,1964,1963,1962,1961
This statistics in other country:
AfghanistanAlbaniaAlgeriaAngolaAntigua and BarbudaArab WorldArgentinaArmeniaArubaAustraliaAustriaAzerbaijanBahamas, TheBahrainBangladeshBarbadosBelarusBelgiumBelizeBeninBhutanBoliviaBosnia and HerzegovinaBotswanaBrazilBrunei DarussalamBulgariaBurkina FasoBurundiCabo VerdeCambodiaCameroonCanadaCaribbean small statesCentral African RepublicCentral Europe and the BalticsChadChannel IslandsChileChinaColombiaComorosCongo, Dem. Rep.Congo, Rep.Costa RicaCote d'IvoireCroatiaCubaCuracaoCyprusCzech RepublicDenmarkDjiboutiDominicaDominican RepublicEarly-demographic dividendEast Asia & PacificEast Asia & Pacific (excluding high income)East Asia & Pacific (IDA & IBRD countries)EcuadorEgypt, Arab Rep.El SalvadorEquatorial GuineaEritreaEstoniaEthiopiaEuro areaEurope & Central AsiaEurope & Central Asia (excluding high income)Europe & Central Asia (IDA & IBRD countries)European UnionFijiFinlandFragile and conflict affected situationsFranceFrench PolynesiaGabonGambia, TheGeorgiaGermanyGhanaGreeceGreenlandGrenadaGuamGuatemalaGuineaGuinea-BissauGuyanaHaitiHeavily indebted poor countries (HIPC)High incomeHondurasHong Kong SAR, ChinaHungaryIBRD onlyIcelandIDA & IBRD totalIDA blendIDA onlyIDA totalIndiaIndonesiaIran, Islamic Rep.IraqIrelandIsraelItalyJamaicaJapanJordanKazakhstanKenyaKiribatiKorea, Dem. People’s Rep.Korea, Rep.KuwaitKyrgyz RepublicLao PDRLate-demographic dividendLatin America & Caribbean Latin America & Caribbean (excluding high income)Latin America & the Caribbean (IDA & IBRD countries)LatviaLeast developed countries: UN classificationLebanonLesothoLiberiaLibyaLithuaniaLow & middle incomeLow incomeLower middle incomeLuxembourgMacao SAR, ChinaMacedonia, FYRMadagascarMalawiMalaysiaMaldivesMaliMaltaMarshall IslandsMauritaniaMauritiusMexicoMicronesia, Fed. Sts.Middle East & North AfricaMiddle East & North Africa (excluding high income)Middle East & North Africa (IDA & IBRD countries)Middle incomeMoldovaMongoliaMontenegroMoroccoMozambiqueMyanmarNamibiaNepalNetherlandsNew CaledoniaNew ZealandNicaraguaNigerNigeriaNorth AmericaNorwayOECD membersOmanOther small statesPacific island small statesPakistanPanamaPapua New GuineaParaguayPeruPhilippinesPolandPortugalPost-demographic dividendPre-demographic dividendPuerto RicoQatarRomaniaRussian FederationRwandaSamoaSao Tome and PrincipeSaudi ArabiaSenegalSerbiaSeychellesSierra LeoneSingaporeSlovak RepublicSloveniaSmall statesSolomon IslandsSomaliaSouth AfricaSouth AsiaSouth Asia (IDA & IBRD)South SudanSpainSri LankaSt. Kitts and NevisSt. LuciaSt. Vincent and the GrenadinesSub-Saharan Africa Sub-Saharan Africa (excluding high income)Sub-Saharan Africa (IDA & IBRD countries)SudanSurinameSwazilandSwedenSwitzerlandSyrian Arab RepublicTajikistanTanzaniaThailandTimor-LesteTogoTongaTrinidad and TobagoTunisiaTurkeyTurkmenistanUgandaUkraineUnited Arab EmiratesUnited KingdomUnited StatesUpper middle incomeUruguayUzbekistanVanuatuVenezuela, RBVietnamVirgin Islands (U.S.)West Bank and GazaWorldYemen, Rep.ZambiaZimbabwe Timeline:
This timeline shows a graph from 1961 to 2015 of Cameroon. No data until 1960. Number of actual observations by date: 55.
Source name:
World Development Indicators
Source organization:
(1) United Nations Population Division. World Population Prospects. New York, United Nations, Department of Economic and Social Affairs (advanced Excel tables). Available at http://esa.un.org/wpp/unpp/panel_population.htm, (2) University of California, Berkeley, and Max Planck Institute for Demographic Research. Human Mortality Database. [ www.mortality.org or www.humanmortality.de].
Categories, topics:
Health, Gender
Last updated:
apr 23, 2017
Indicators value changes by year
Minimum:
346.899
jan 1, 1988
Maximum:
462.007
jan 1, 1961
At the date of observation
Value
Absolute change
Change from previous value
jan 1, 1961
462.007
+462.007
0.0%
jan 1, 1962
456.931
-5.076
-1.1%
jan 1, 1963
451.855
-5.076
-1.11%
jan 1, 1964
446.984
-4.871
-1.08%
jan 1, 1965
442.112
-4.872
-1.09%
jan 1, 1966
437.241
-4.871
-1.1%
jan 1, 1967
432.37
-4.871
-1.11%
jan 1, 1968
427.498
-4.872
-1.13%
jan 1, 1969
422.539
-4.959
-1.16%
jan 1, 1970
417.58
-4.959
-1.17%
jan 1, 1971
412.621
-4.959
-1.19%
jan 1, 1972
407.661
-4.96
-1.2%
jan 1, 1973
402.702
-4.959
-1.22%
jan 1, 1974
397.668
-5.034
-1.25%
jan 1, 1975
392.634
-5.034
-1.27%
jan 1, 1976
387.6
-5.034
-1.28%
jan 1, 1977
382.566
-5.034
-1.3%
jan 1, 1978
377.531
-5.035
-1.32%
jan 1, 1979
373.329
-4.202
-1.11%
jan 1, 1980
369.127
-4.202
-1.13%
jan 1, 1981
364.924
-4.203
-1.14%
jan 1, 1982
360.722
-4.202
-1.15%
jan 1, 1983
356.52
-4.202
-1.16%
jan 1, 1984
354.595
-1.925
-0.54%
jan 1, 1985
352.671
-1.924
-0.54%
jan 1, 1986
350.747
-1.924
-0.55%
jan 1, 1987
348.823
-1.924
-0.55%
jan 1, 1988
346.899
-1.924
-0.55%
jan 1, 1989
348.45
+1.551
0.45%
jan 1, 1990
350.001
+1.551
0.45%
jan 1, 1991
351.553
+1.552
0.44%
jan 1, 1992
353.104
+1.551
0.44%
jan 1, 1993
354.656
+1.552
0.44%
jan 1, 1994
361.536
+6.88
1.94%
jan 1, 1995
368.416
+6.88
1.9%
jan 1, 1996
375.296
+6.88
1.87%
jan 1, 1997
382.175
+6.879
1.83%
jan 1, 1998
389.055
+6.88
1.8%
jan 1, 1999
395.396
+6.341
1.63%
jan 1, 2000
401.737
+6.341
1.6%
jan 1, 2001
408.079
+6.342
1.58%
jan 1, 2002
414.42
+6.341
1.55%
jan 1, 2003
420.761
+6.341
1.53%
jan 1, 2004
416.779
-3.982
-0.95%
jan 1, 2005
412.797
-3.982
-0.96%
jan 1, 2006
408.815
-3.982
-0.96%
jan 1, 2007
404.833
-3.982
-0.97%
jan 1, 2008
400.851
-3.982
-0.98%
jan 1, 2009
396.436
-4.415
-1.1%
jan 1, 2010
392.021
-4.415
-1.11%
jan 1, 2011
387.606
-4.415
-1.13%
jan 1, 2012
383.191
-4.415
-1.14%
jan 1, 2013
378.776
-4.415
-1.15%
jan 1, 2014
374.49
-4.286
-1.13%
jan 1, 2015
370.204
-4.286
-1.14%
Ranking of countries by current statistics by years


Comments: