29
/
en
AIzaSyAYiBZKx7MnpbEhh9jyipgxe19OcubqV5w
April 1, 2024
165155
Jordan
JOR
true
2
1
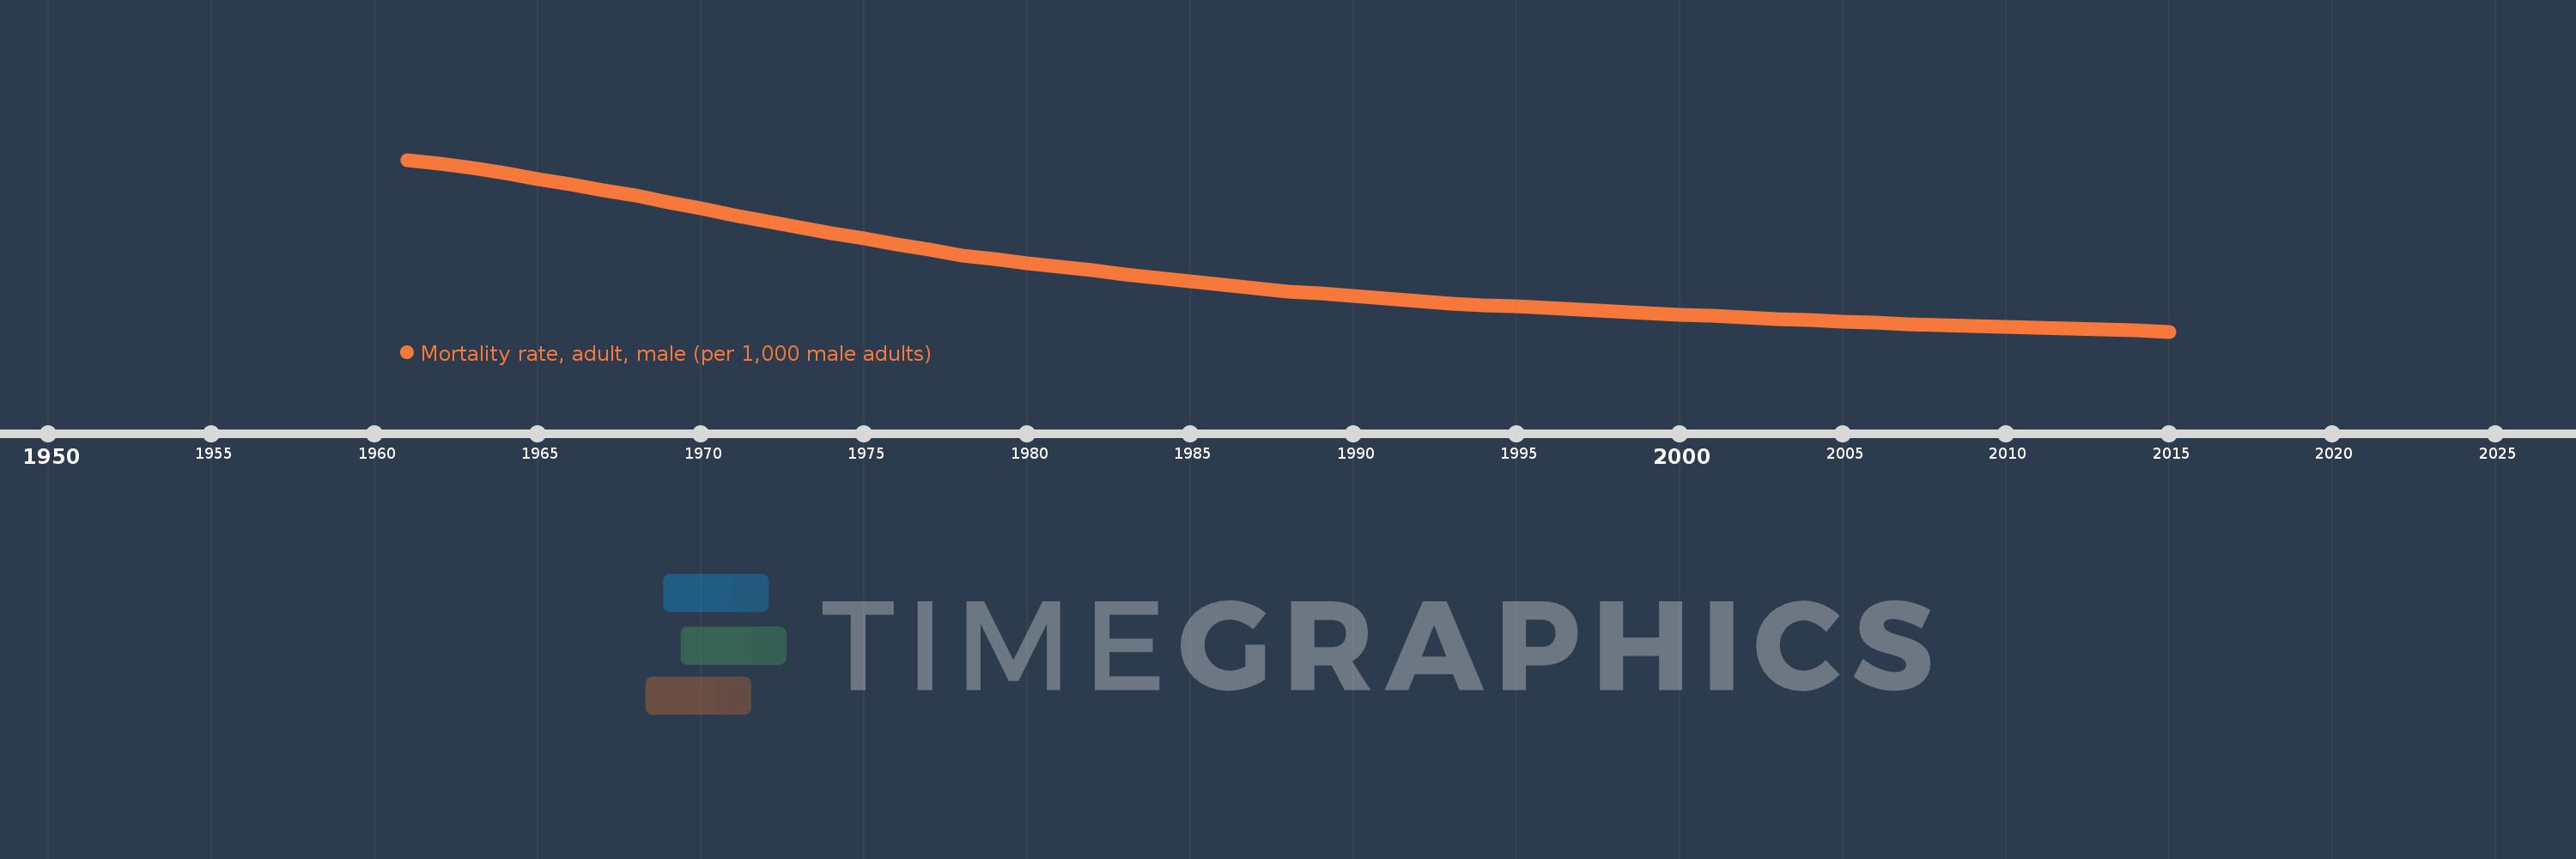
Mortality rate, adult, male (per 1,000 male adults)
2015,2014,2013,2012,2011,2010,2009,2008,2007,2006,2005,2004,2003,2002,2001,2000,1999,1998,1997,1996,1995,1994,1993,1992,1991,1990,1989,1988,1987,1986,1985,1984,1983,1982,1981,1980,1979,1978,1977,1976,1975,1974,1973,1972,1971,1970,1969,1968,1967,1966,1965,1964,1963,1962,1961
This statistics in other country:
AfghanistanAlbaniaAlgeriaAngolaAntigua and BarbudaArab WorldArgentinaArmeniaArubaAustraliaAustriaAzerbaijanBahamas, TheBahrainBangladeshBarbadosBelarusBelgiumBelizeBeninBhutanBoliviaBosnia and HerzegovinaBotswanaBrazilBrunei DarussalamBulgariaBurkina FasoBurundiCabo VerdeCambodiaCameroonCanadaCaribbean small statesCentral African RepublicCentral Europe and the BalticsChadChannel IslandsChileChinaColombiaComorosCongo, Dem. Rep.Congo, Rep.Costa RicaCote d'IvoireCroatiaCubaCuracaoCyprusCzech RepublicDenmarkDjiboutiDominicaDominican RepublicEarly-demographic dividendEast Asia & PacificEast Asia & Pacific (excluding high income)East Asia & Pacific (IDA & IBRD countries)EcuadorEgypt, Arab Rep.El SalvadorEquatorial GuineaEritreaEstoniaEthiopiaEuro areaEurope & Central AsiaEurope & Central Asia (excluding high income)Europe & Central Asia (IDA & IBRD countries)European UnionFijiFinlandFragile and conflict affected situationsFranceFrench PolynesiaGabonGambia, TheGeorgiaGermanyGhanaGreeceGreenlandGrenadaGuamGuatemalaGuineaGuinea-BissauGuyanaHaitiHeavily indebted poor countries (HIPC)High incomeHondurasHong Kong SAR, ChinaHungaryIBRD onlyIcelandIDA & IBRD totalIDA blendIDA onlyIDA totalIndiaIndonesiaIran, Islamic Rep.IraqIrelandIsraelItalyJamaicaJapanJordanKazakhstanKenyaKiribatiKorea, Dem. People’s Rep.Korea, Rep.KuwaitKyrgyz RepublicLao PDRLate-demographic dividendLatin America & Caribbean Latin America & Caribbean (excluding high income)Latin America & the Caribbean (IDA & IBRD countries)LatviaLeast developed countries: UN classificationLebanonLesothoLiberiaLibyaLithuaniaLow & middle incomeLow incomeLower middle incomeLuxembourgMacao SAR, ChinaMacedonia, FYRMadagascarMalawiMalaysiaMaldivesMaliMaltaMarshall IslandsMauritaniaMauritiusMexicoMicronesia, Fed. Sts.Middle East & North AfricaMiddle East & North Africa (excluding high income)Middle East & North Africa (IDA & IBRD countries)Middle incomeMoldovaMongoliaMontenegroMoroccoMozambiqueMyanmarNamibiaNepalNetherlandsNew CaledoniaNew ZealandNicaraguaNigerNigeriaNorth AmericaNorwayOECD membersOmanOther small statesPacific island small statesPakistanPanamaPapua New GuineaParaguayPeruPhilippinesPolandPortugalPost-demographic dividendPre-demographic dividendPuerto RicoQatarRomaniaRussian FederationRwandaSamoaSao Tome and PrincipeSaudi ArabiaSenegalSerbiaSeychellesSierra LeoneSingaporeSlovak RepublicSloveniaSmall statesSolomon IslandsSomaliaSouth AfricaSouth AsiaSouth Asia (IDA & IBRD)South SudanSpainSri LankaSt. Kitts and NevisSt. LuciaSt. Vincent and the GrenadinesSub-Saharan Africa Sub-Saharan Africa (excluding high income)Sub-Saharan Africa (IDA & IBRD countries)SudanSurinameSwazilandSwedenSwitzerlandSyrian Arab RepublicTajikistanTanzaniaThailandTimor-LesteTogoTongaTrinidad and TobagoTunisiaTurkeyTurkmenistanUgandaUkraineUnited Arab EmiratesUnited KingdomUnited StatesUpper middle incomeUruguayUzbekistanVanuatuVenezuela, RBVietnamVirgin Islands (U.S.)West Bank and GazaWorldYemen, Rep.ZambiaZimbabwe Timeline:
This timeline shows a graph from 1961 to 2015 of Jordan. No data until 1960. Number of actual observations by date: 55.
Source name:
World Development Indicators
Source organization:
(1) United Nations Population Division. World Population Prospects. New York, United Nations, Department of Economic and Social Affairs (advanced Excel tables). Available at http://esa.un.org/wpp/unpp/panel_population.htm, (2) University of California, Berkeley, and Max Planck Institute for Demographic Research. Human Mortality Database. [ www.mortality.org or www.humanmortality.de].
Categories, topics:
Health, Gender
Last updated:
apr 23, 2017
Indicators value changes by year
Minimum:
128.291
jan 1, 2015
Maximum:
358.651
jan 1, 1961
At the date of observation
Value
Absolute change
Change from previous value
jan 1, 1961
358.651
+358.651
0.0%
jan 1, 1962
353.164
-5.487
-1.53%
jan 1, 1963
347.676
-5.488
-1.55%
jan 1, 1964
340.264
-7.412
-2.13%
jan 1, 1965
332.852
-7.412
-2.18%
jan 1, 1966
325.44
-7.412
-2.23%
jan 1, 1967
318.028
-7.412
-2.28%
jan 1, 1968
310.615
-7.413
-2.33%
jan 1, 1969
302.053
-8.562
-2.76%
jan 1, 1970
293.49
-8.563
-2.83%
jan 1, 1971
284.927
-8.563
-2.92%
jan 1, 1972
276.364
-8.563
-3.01%
jan 1, 1973
267.802
-8.562
-3.1%
jan 1, 1974
260.345
-7.457
-2.78%
jan 1, 1975
252.889
-7.456
-2.86%
jan 1, 1976
245.433
-7.456
-2.95%
jan 1, 1977
237.976
-7.457
-3.04%
jan 1, 1978
230.52
-7.456
-3.13%
jan 1, 1979
225.462
-5.058
-2.19%
jan 1, 1980
220.403
-5.059
-2.24%
jan 1, 1981
215.345
-5.058
-2.29%
jan 1, 1982
210.287
-5.058
-2.35%
jan 1, 1983
205.229
-5.058
-2.41%
jan 1, 1984
200.631
-4.598
-2.24%
jan 1, 1985
196.033
-4.598
-2.29%
jan 1, 1986
191.435
-4.598
-2.35%
jan 1, 1987
186.836
-4.599
-2.4%
jan 1, 1988
182.238
-4.598
-2.46%
jan 1, 1989
179.016
-3.222
-1.77%
jan 1, 1990
175.794
-3.222
-1.8%
jan 1, 1991
172.571
-3.223
-1.83%
jan 1, 1992
169.349
-3.222
-1.87%
jan 1, 1993
166.127
-3.222
-1.9%
jan 1, 1994
163.959
-2.168
-1.31%
jan 1, 1995
161.791
-2.168
-1.32%
jan 1, 1996
159.623
-2.168
-1.34%
jan 1, 1997
157.456
-2.167
-1.36%
jan 1, 1998
155.288
-2.168
-1.38%
jan 1, 1999
153.298
-1.99
-1.28%
jan 1, 2000
151.307
-1.991
-1.3%
jan 1, 2001
149.317
-1.99
-1.32%
jan 1, 2002
147.327
-1.99
-1.33%
jan 1, 2003
145.337
-1.99
-1.35%
jan 1, 2004
143.56
-1.777
-1.22%
jan 1, 2005
141.783
-1.777
-1.24%
jan 1, 2006
140.006
-1.777
-1.25%
jan 1, 2007
138.229
-1.777
-1.27%
jan 1, 2008
136.452
-1.777
-1.29%
jan 1, 2009
135.297
-1.155
-0.85%
jan 1, 2010
134.142
-1.155
-0.85%
jan 1, 2011
132.986
-1.156
-0.86%
jan 1, 2012
131.831
-1.155
-0.87%
jan 1, 2013
130.676
-1.155
-0.88%
jan 1, 2014
129.484
-1.192
-0.91%
jan 1, 2015
128.291
-1.193
-0.92%
Ranking of countries by current statistics by years


Comments: