29
/
en
AIzaSyAYiBZKx7MnpbEhh9jyipgxe19OcubqV5w
April 1, 2024
74188
Austria
AUT
true
2
1
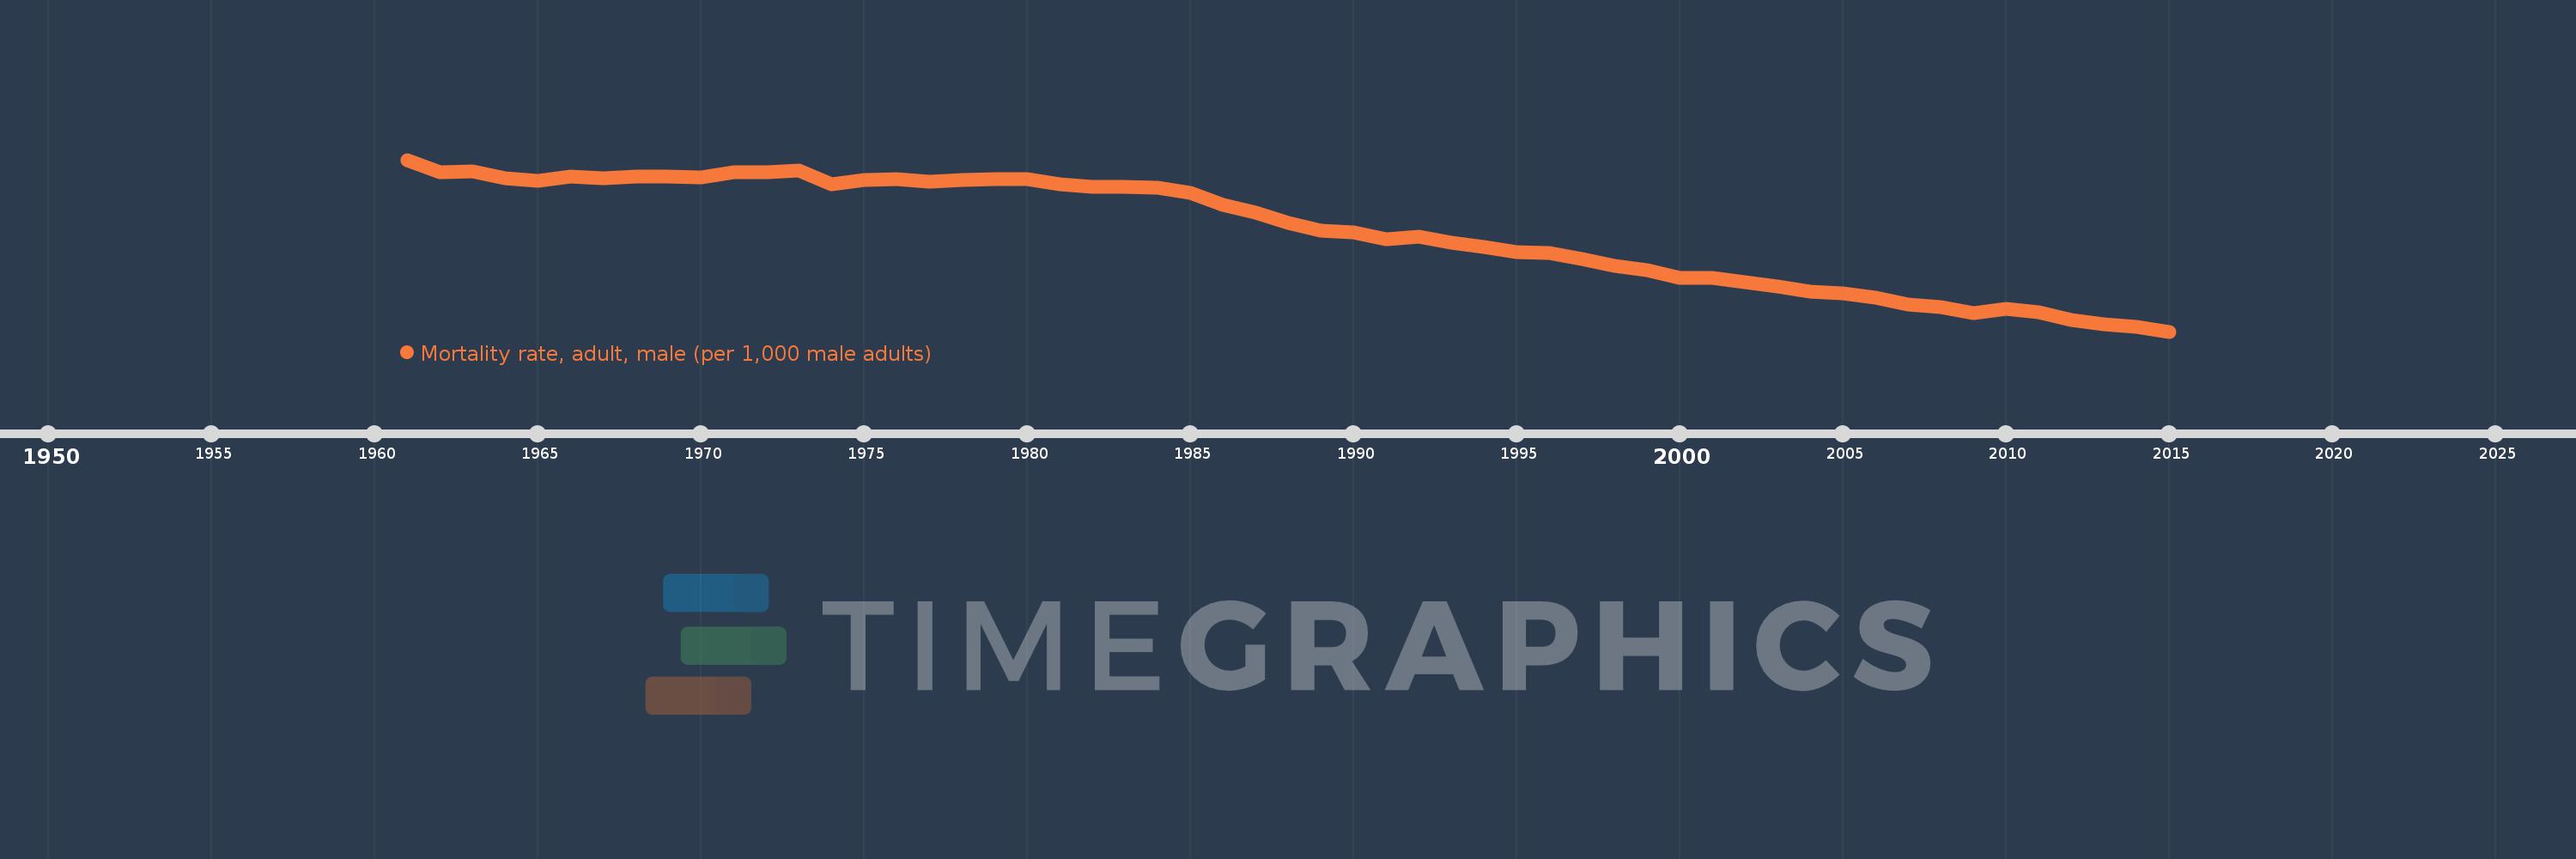
Mortality rate, adult, male (per 1,000 male adults)
2015,2014,2013,2012,2011,2010,2009,2008,2007,2006,2005,2004,2003,2002,2001,2000,1999,1998,1997,1996,1995,1994,1993,1992,1991,1990,1989,1988,1987,1986,1985,1984,1983,1982,1981,1980,1979,1978,1977,1976,1975,1974,1973,1972,1971,1970,1969,1968,1967,1966,1965,1964,1963,1962,1961
This statistics in other country:
AfghanistanAlbaniaAlgeriaAngolaAntigua and BarbudaArab WorldArgentinaArmeniaArubaAustraliaAustriaAzerbaijanBahamas, TheBahrainBangladeshBarbadosBelarusBelgiumBelizeBeninBhutanBoliviaBosnia and HerzegovinaBotswanaBrazilBrunei DarussalamBulgariaBurkina FasoBurundiCabo VerdeCambodiaCameroonCanadaCaribbean small statesCentral African RepublicCentral Europe and the BalticsChadChannel IslandsChileChinaColombiaComorosCongo, Dem. Rep.Congo, Rep.Costa RicaCote d'IvoireCroatiaCubaCuracaoCyprusCzech RepublicDenmarkDjiboutiDominicaDominican RepublicEarly-demographic dividendEast Asia & PacificEast Asia & Pacific (excluding high income)East Asia & Pacific (IDA & IBRD countries)EcuadorEgypt, Arab Rep.El SalvadorEquatorial GuineaEritreaEstoniaEthiopiaEuro areaEurope & Central AsiaEurope & Central Asia (excluding high income)Europe & Central Asia (IDA & IBRD countries)European UnionFijiFinlandFragile and conflict affected situationsFranceFrench PolynesiaGabonGambia, TheGeorgiaGermanyGhanaGreeceGreenlandGrenadaGuamGuatemalaGuineaGuinea-BissauGuyanaHaitiHeavily indebted poor countries (HIPC)High incomeHondurasHong Kong SAR, ChinaHungaryIBRD onlyIcelandIDA & IBRD totalIDA blendIDA onlyIDA totalIndiaIndonesiaIran, Islamic Rep.IraqIrelandIsraelItalyJamaicaJapanJordanKazakhstanKenyaKiribatiKorea, Dem. People’s Rep.Korea, Rep.KuwaitKyrgyz RepublicLao PDRLate-demographic dividendLatin America & Caribbean Latin America & Caribbean (excluding high income)Latin America & the Caribbean (IDA & IBRD countries)LatviaLeast developed countries: UN classificationLebanonLesothoLiberiaLibyaLithuaniaLow & middle incomeLow incomeLower middle incomeLuxembourgMacao SAR, ChinaMacedonia, FYRMadagascarMalawiMalaysiaMaldivesMaliMaltaMarshall IslandsMauritaniaMauritiusMexicoMicronesia, Fed. Sts.Middle East & North AfricaMiddle East & North Africa (excluding high income)Middle East & North Africa (IDA & IBRD countries)Middle incomeMoldovaMongoliaMontenegroMoroccoMozambiqueMyanmarNamibiaNepalNetherlandsNew CaledoniaNew ZealandNicaraguaNigerNigeriaNorth AmericaNorwayOECD membersOmanOther small statesPacific island small statesPakistanPanamaPapua New GuineaParaguayPeruPhilippinesPolandPortugalPost-demographic dividendPre-demographic dividendPuerto RicoQatarRomaniaRussian FederationRwandaSamoaSao Tome and PrincipeSaudi ArabiaSenegalSerbiaSeychellesSierra LeoneSingaporeSlovak RepublicSloveniaSmall statesSolomon IslandsSomaliaSouth AfricaSouth AsiaSouth Asia (IDA & IBRD)South SudanSpainSri LankaSt. Kitts and NevisSt. LuciaSt. Vincent and the GrenadinesSub-Saharan Africa Sub-Saharan Africa (excluding high income)Sub-Saharan Africa (IDA & IBRD countries)SudanSurinameSwazilandSwedenSwitzerlandSyrian Arab RepublicTajikistanTanzaniaThailandTimor-LesteTogoTongaTrinidad and TobagoTunisiaTurkeyTurkmenistanUgandaUkraineUnited Arab EmiratesUnited KingdomUnited StatesUpper middle incomeUruguayUzbekistanVanuatuVenezuela, RBVietnamVirgin Islands (U.S.)West Bank and GazaWorldYemen, Rep.ZambiaZimbabwe Timeline:
This timeline shows a graph from 1961 to 2015 of Austria. No data until 1960. Number of actual observations by date: 55.
Source name:
World Development Indicators
Source organization:
(1) United Nations Population Division. World Population Prospects. New York, United Nations, Department of Economic and Social Affairs (advanced Excel tables). Available at http://esa.un.org/wpp/unpp/panel_population.htm, (2) University of California, Berkeley, and Max Planck Institute for Demographic Research. Human Mortality Database. [ www.mortality.org or www.humanmortality.de].
Categories, topics:
Health, Gender
Last updated:
apr 23, 2017
Indicators value changes by year
Minimum:
85.631
jan 1, 2015
Maximum:
215.263
jan 1, 1961
At the date of observation
Value
Absolute change
Change from previous value
jan 1, 1961
215.263
+215.263
0.0%
jan 1, 1962
205.875
-9.388
-4.36%
jan 1, 1963
206.275
+0.4
0.19%
jan 1, 1964
201.23
-5.045
-2.45%
jan 1, 1965
199.546
-1.684
-0.84%
jan 1, 1966
202.429
+2.883
1.44%
jan 1, 1967
201.227
-1.202
-0.59%
jan 1, 1968
202.527
+1.3
0.65%
jan 1, 1969
202.723
+0.196
0.1%
jan 1, 1970
202.263
-0.46
-0.23%
jan 1, 1971
206.058
+3.795
1.88%
jan 1, 1972
205.93
-0.128
-0.06%
jan 1, 1973
206.936
+1.006
0.49%
jan 1, 1974
197.095
-9.841
-4.76%
jan 1, 1975
199.838
+2.743
1.39%
jan 1, 1976
200.71
+0.872
0.44%
jan 1, 1977
198.504
-2.206
-1.1%
jan 1, 1978
199.746
+1.242
0.63%
jan 1, 1979
200.74
+0.994
0.5%
jan 1, 1980
200.945
+0.205
0.1%
jan 1, 1981
196.753
-4.192
-2.09%
jan 1, 1982
195.014
-1.739
-0.88%
jan 1, 1983
194.749
-0.265
-0.14%
jan 1, 1984
193.896
-0.853
-0.44%
jan 1, 1985
190.115
-3.781
-1.95%
jan 1, 1986
181.013
-9.102
-4.79%
jan 1, 1987
175.19
-5.823
-3.22%
jan 1, 1988
167.726
-7.464
-4.26%
jan 1, 1989
161.955
-5.771
-3.44%
jan 1, 1990
160.399
-1.556
-0.96%
jan 1, 1991
155.025
-5.374
-3.35%
jan 1, 1992
157.502
+2.477
1.6%
jan 1, 1993
152.872
-4.63
-2.94%
jan 1, 1994
149.693
-3.179
-2.08%
jan 1, 1995
145.736
-3.957
-2.64%
jan 1, 1996
145.057
-0.679
-0.47%
jan 1, 1997
140.373
-4.684
-3.23%
jan 1, 1998
134.972
-5.401
-3.85%
jan 1, 1999
131.697
-3.275
-2.43%
jan 1, 2000
125.992
-5.705
-4.33%
jan 1, 2001
126.288
+0.296
0.23%
jan 1, 2002
122.852
-3.436
-2.72%
jan 1, 2003
119.923
-2.929
-2.38%
jan 1, 2004
115.829
-4.094
-3.41%
jan 1, 2005
114.44
-1.389
-1.2%
jan 1, 2006
111.396
-3.044
-2.66%
jan 1, 2007
105.736
-5.66
-5.08%
jan 1, 2008
104.203
-1.533
-1.45%
jan 1, 2009
99.627
-4.576
-4.39%
jan 1, 2010
102.95
+3.323
3.34%
jan 1, 2011
100.294
-2.656
-2.58%
jan 1, 2012
94.337
-5.957
-5.94%
jan 1, 2013
91.344
-2.993
-3.17%
jan 1, 2014
89.368
-1.976
-2.16%
jan 1, 2015
85.631
-3.737
-4.18%
Ranking of countries by current statistics by years


Comments: