29
/
en
AIzaSyAYiBZKx7MnpbEhh9jyipgxe19OcubqV5w
April 1, 2024
60033
Sub-Saharan Africa (excluding high income)
SSA
false
2
1
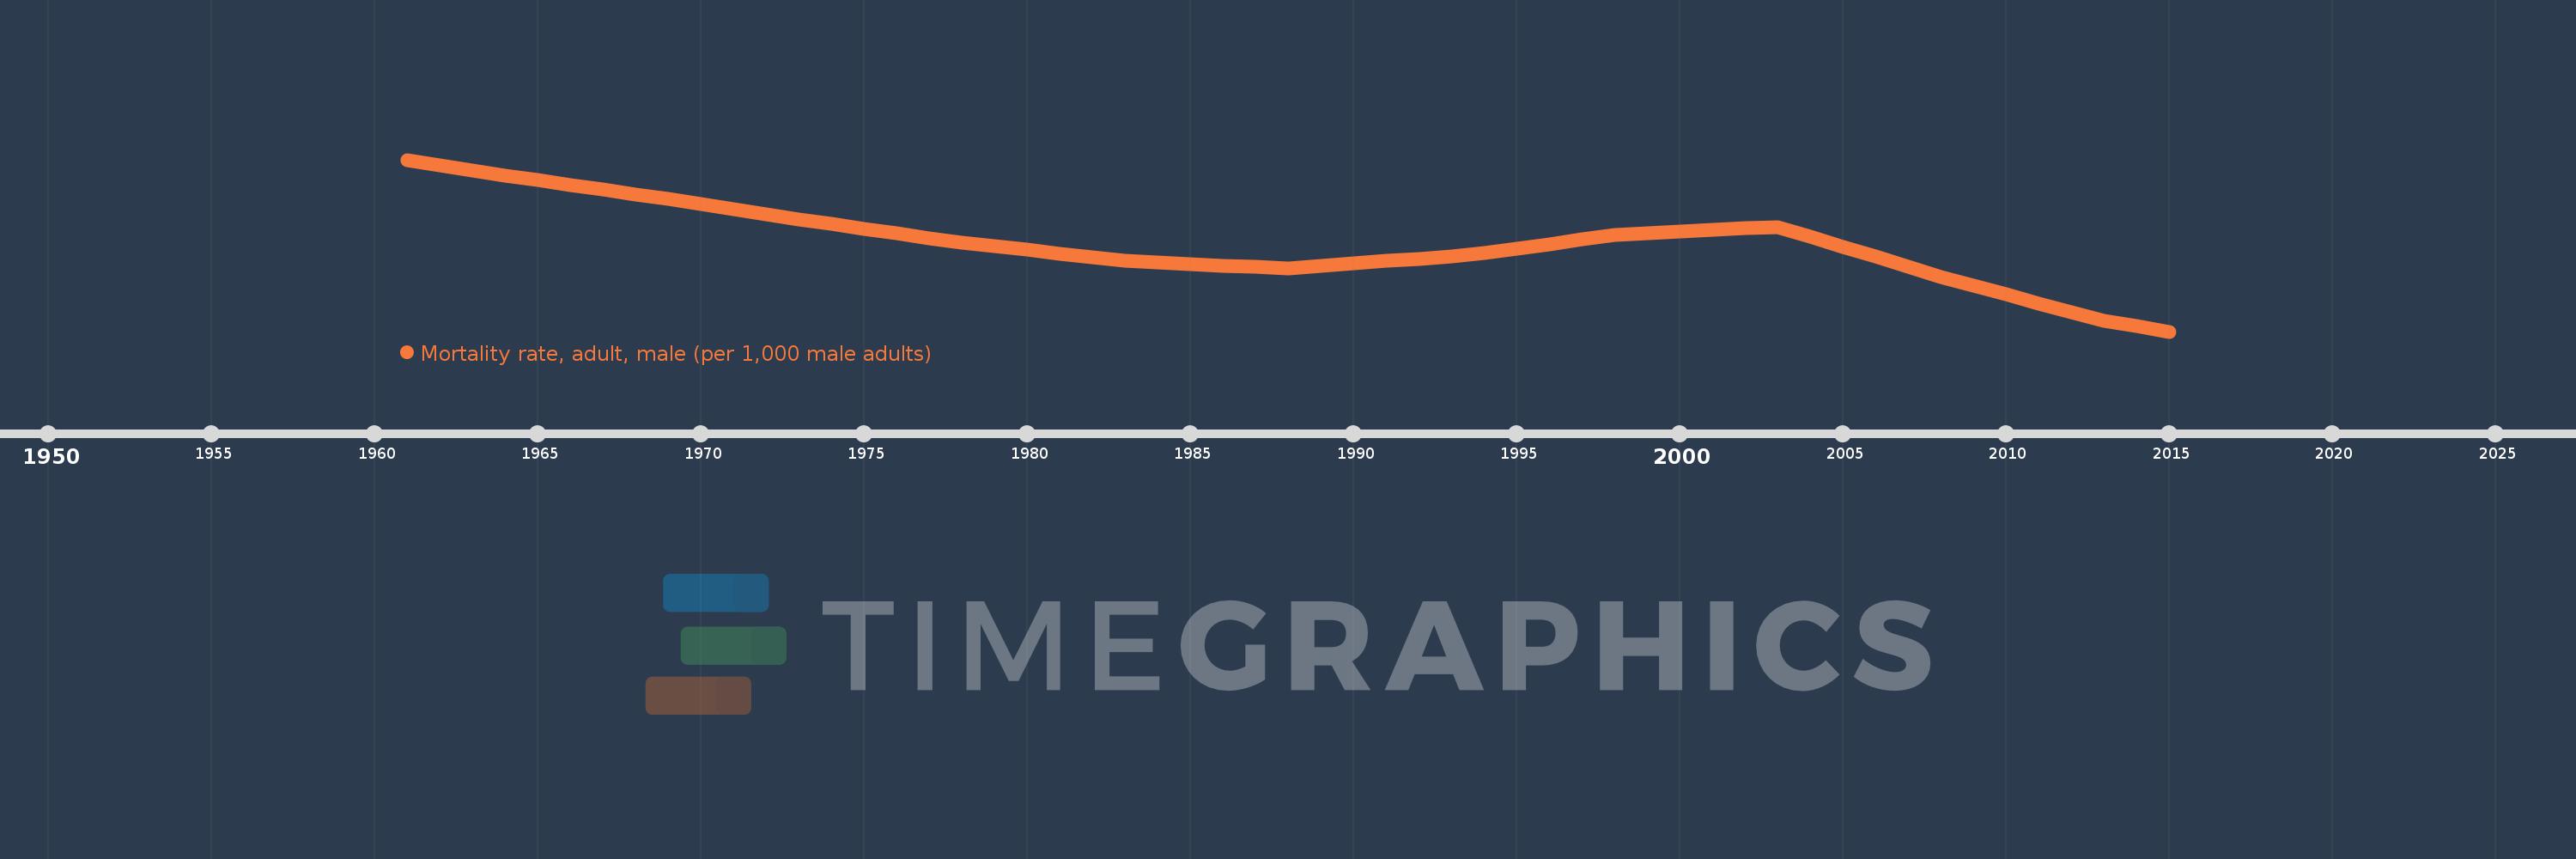
Mortality rate, adult, male (per 1,000 male adults)
2015,2014,2013,2012,2011,2010,2009,2008,2007,2006,2005,2004,2003,2002,2001,2000,1999,1998,1997,1996,1995,1994,1993,1992,1991,1990,1989,1988,1987,1986,1985,1984,1983,1982,1981,1980,1979,1978,1977,1976,1975,1974,1973,1972,1971,1970,1969,1968,1967,1966,1965,1964,1963,1962,1961
This statistics in other country:
AfghanistanAlbaniaAlgeriaAngolaAntigua and BarbudaArab WorldArgentinaArmeniaArubaAustraliaAustriaAzerbaijanBahamas, TheBahrainBangladeshBarbadosBelarusBelgiumBelizeBeninBhutanBoliviaBosnia and HerzegovinaBotswanaBrazilBrunei DarussalamBulgariaBurkina FasoBurundiCabo VerdeCambodiaCameroonCanadaCaribbean small statesCentral African RepublicCentral Europe and the BalticsChadChannel IslandsChileChinaColombiaComorosCongo, Dem. Rep.Congo, Rep.Costa RicaCote d'IvoireCroatiaCubaCuracaoCyprusCzech RepublicDenmarkDjiboutiDominicaDominican RepublicEarly-demographic dividendEast Asia & PacificEast Asia & Pacific (excluding high income)East Asia & Pacific (IDA & IBRD countries)EcuadorEgypt, Arab Rep.El SalvadorEquatorial GuineaEritreaEstoniaEthiopiaEuro areaEurope & Central AsiaEurope & Central Asia (excluding high income)Europe & Central Asia (IDA & IBRD countries)European UnionFijiFinlandFragile and conflict affected situationsFranceFrench PolynesiaGabonGambia, TheGeorgiaGermanyGhanaGreeceGreenlandGrenadaGuamGuatemalaGuineaGuinea-BissauGuyanaHaitiHeavily indebted poor countries (HIPC)High incomeHondurasHong Kong SAR, ChinaHungaryIBRD onlyIcelandIDA & IBRD totalIDA blendIDA onlyIDA totalIndiaIndonesiaIran, Islamic Rep.IraqIrelandIsraelItalyJamaicaJapanJordanKazakhstanKenyaKiribatiKorea, Dem. People’s Rep.Korea, Rep.KuwaitKyrgyz RepublicLao PDRLate-demographic dividendLatin America & Caribbean Latin America & Caribbean (excluding high income)Latin America & the Caribbean (IDA & IBRD countries)LatviaLeast developed countries: UN classificationLebanonLesothoLiberiaLibyaLithuaniaLow & middle incomeLow incomeLower middle incomeLuxembourgMacao SAR, ChinaMacedonia, FYRMadagascarMalawiMalaysiaMaldivesMaliMaltaMarshall IslandsMauritaniaMauritiusMexicoMicronesia, Fed. Sts.Middle East & North AfricaMiddle East & North Africa (excluding high income)Middle East & North Africa (IDA & IBRD countries)Middle incomeMoldovaMongoliaMontenegroMoroccoMozambiqueMyanmarNamibiaNepalNetherlandsNew CaledoniaNew ZealandNicaraguaNigerNigeriaNorth AmericaNorwayOECD membersOmanOther small statesPacific island small statesPakistanPanamaPapua New GuineaParaguayPeruPhilippinesPolandPortugalPost-demographic dividendPre-demographic dividendPuerto RicoQatarRomaniaRussian FederationRwandaSamoaSao Tome and PrincipeSaudi ArabiaSenegalSerbiaSeychellesSierra LeoneSingaporeSlovak RepublicSloveniaSmall statesSolomon IslandsSomaliaSouth AfricaSouth AsiaSouth Asia (IDA & IBRD)South SudanSpainSri LankaSt. Kitts and NevisSt. LuciaSt. Vincent and the GrenadinesSub-Saharan Africa Sub-Saharan Africa (excluding high income)Sub-Saharan Africa (IDA & IBRD countries)SudanSurinameSwazilandSwedenSwitzerlandSyrian Arab RepublicTajikistanTanzaniaThailandTimor-LesteTogoTongaTrinidad and TobagoTunisiaTurkeyTurkmenistanUgandaUkraineUnited Arab EmiratesUnited KingdomUnited StatesUpper middle incomeUruguayUzbekistanVanuatuVenezuela, RBVietnamVirgin Islands (U.S.)West Bank and GazaWorldYemen, Rep.ZambiaZimbabwe Timeline:
This timeline shows a graph from 1961 to 2015 of Sub-Saharan Africa (excluding high income). No data until 1960. Number of actual observations by date: 55.
Source name:
World Development Indicators
Source organization:
(1) United Nations Population Division. World Population Prospects. New York, United Nations, Department of Economic and Social Affairs (advanced Excel tables). Available at http://esa.un.org/wpp/unpp/panel_population.htm, (2) University of California, Berkeley, and Max Planck Institute for Demographic Research. Human Mortality Database. [ www.mortality.org or www.humanmortality.de].
Categories, topics:
Health, Gender
Last updated:
apr 23, 2017
Indicators value changes by year
Minimum:
328.223
jan 1, 2015
Maximum:
491.279
jan 1, 1961
At the date of observation
Value
Absolute change
Change from previous value
jan 1, 1961
491.279
+491.279
0.0%
jan 1, 1962
486.186
-5.093
-1.04%
jan 1, 1963
481.092
-5.094
-1.05%
jan 1, 1964
476.592
-4.5
-0.94%
jan 1, 1965
472.104
-4.488
-0.94%
jan 1, 1966
467.629
-4.475
-0.95%
jan 1, 1967
463.132
-4.497
-0.96%
jan 1, 1968
458.652
-4.48
-0.97%
jan 1, 1969
453.891
-4.761
-1.04%
jan 1, 1970
449.143
-4.748
-1.05%
jan 1, 1971
444.407
-4.736
-1.05%
jan 1, 1972
439.637
-4.769
-1.07%
jan 1, 1973
434.883
-4.754
-1.08%
jan 1, 1974
430.408
-4.476
-1.03%
jan 1, 1975
425.951
-4.456
-1.04%
jan 1, 1976
421.512
-4.439
-1.04%
jan 1, 1977
417.081
-4.431
-1.05%
jan 1, 1978
412.667
-4.415
-1.06%
jan 1, 1979
409.196
-3.47
-0.84%
jan 1, 1980
405.718
-3.478
-0.85%
jan 1, 1981
402.229
-3.489
-0.86%
jan 1, 1982
398.677
-3.552
-0.88%
jan 1, 1983
395.126
-3.551
-0.89%
jan 1, 1984
393.677
-1.449
-0.37%
jan 1, 1985
392.247
-1.43
-0.36%
jan 1, 1986
390.845
-1.402
-0.36%
jan 1, 1987
389.432
-1.413
-0.36%
jan 1, 1988
388.081
-1.35
-0.35%
jan 1, 1989
390.485
+2.404
0.62%
jan 1, 1990
392.922
+2.437
0.62%
jan 1, 1991
395.331
+2.409
0.61%
jan 1, 1992
397.477
+2.147
0.54%
jan 1, 1993
399.441
+1.964
0.49%
jan 1, 1994
403.218
+3.776
0.95%
jan 1, 1995
407.164
+3.946
0.98%
jan 1, 1996
411.298
+4.135
1.02%
jan 1, 1997
415.574
+4.276
1.04%
jan 1, 1998
419.932
+4.358
1.05%
jan 1, 1999
421.603
+1.671
0.4%
jan 1, 2000
423.214
+1.611
0.38%
jan 1, 2001
424.746
+1.532
0.36%
jan 1, 2002
426.179
+1.433
0.34%
jan 1, 2003
427.485
+1.307
0.31%
jan 1, 2004
418.069
-9.416
-2.2%
jan 1, 2005
408.643
-9.426
-2.25%
jan 1, 2006
399.201
-9.442
-2.31%
jan 1, 2007
389.831
-9.37
-2.35%
jan 1, 2008
380.391
-9.44
-2.42%
jan 1, 2009
371.852
-8.539
-2.24%
jan 1, 2010
363.365
-8.487
-2.28%
jan 1, 2011
354.946
-8.419
-2.32%
jan 1, 2012
346.541
-8.405
-2.37%
jan 1, 2013
338.196
-8.345
-2.41%
jan 1, 2014
333.216
-4.98
-1.47%
jan 1, 2015
328.223
-4.993
-1.5%
Ranking of countries by current statistics by years


Comments: