29
/
en
AIzaSyAYiBZKx7MnpbEhh9jyipgxe19OcubqV5w
April 1, 2024
88848
Bosnia and Herzegovina
BIH
true
2
1
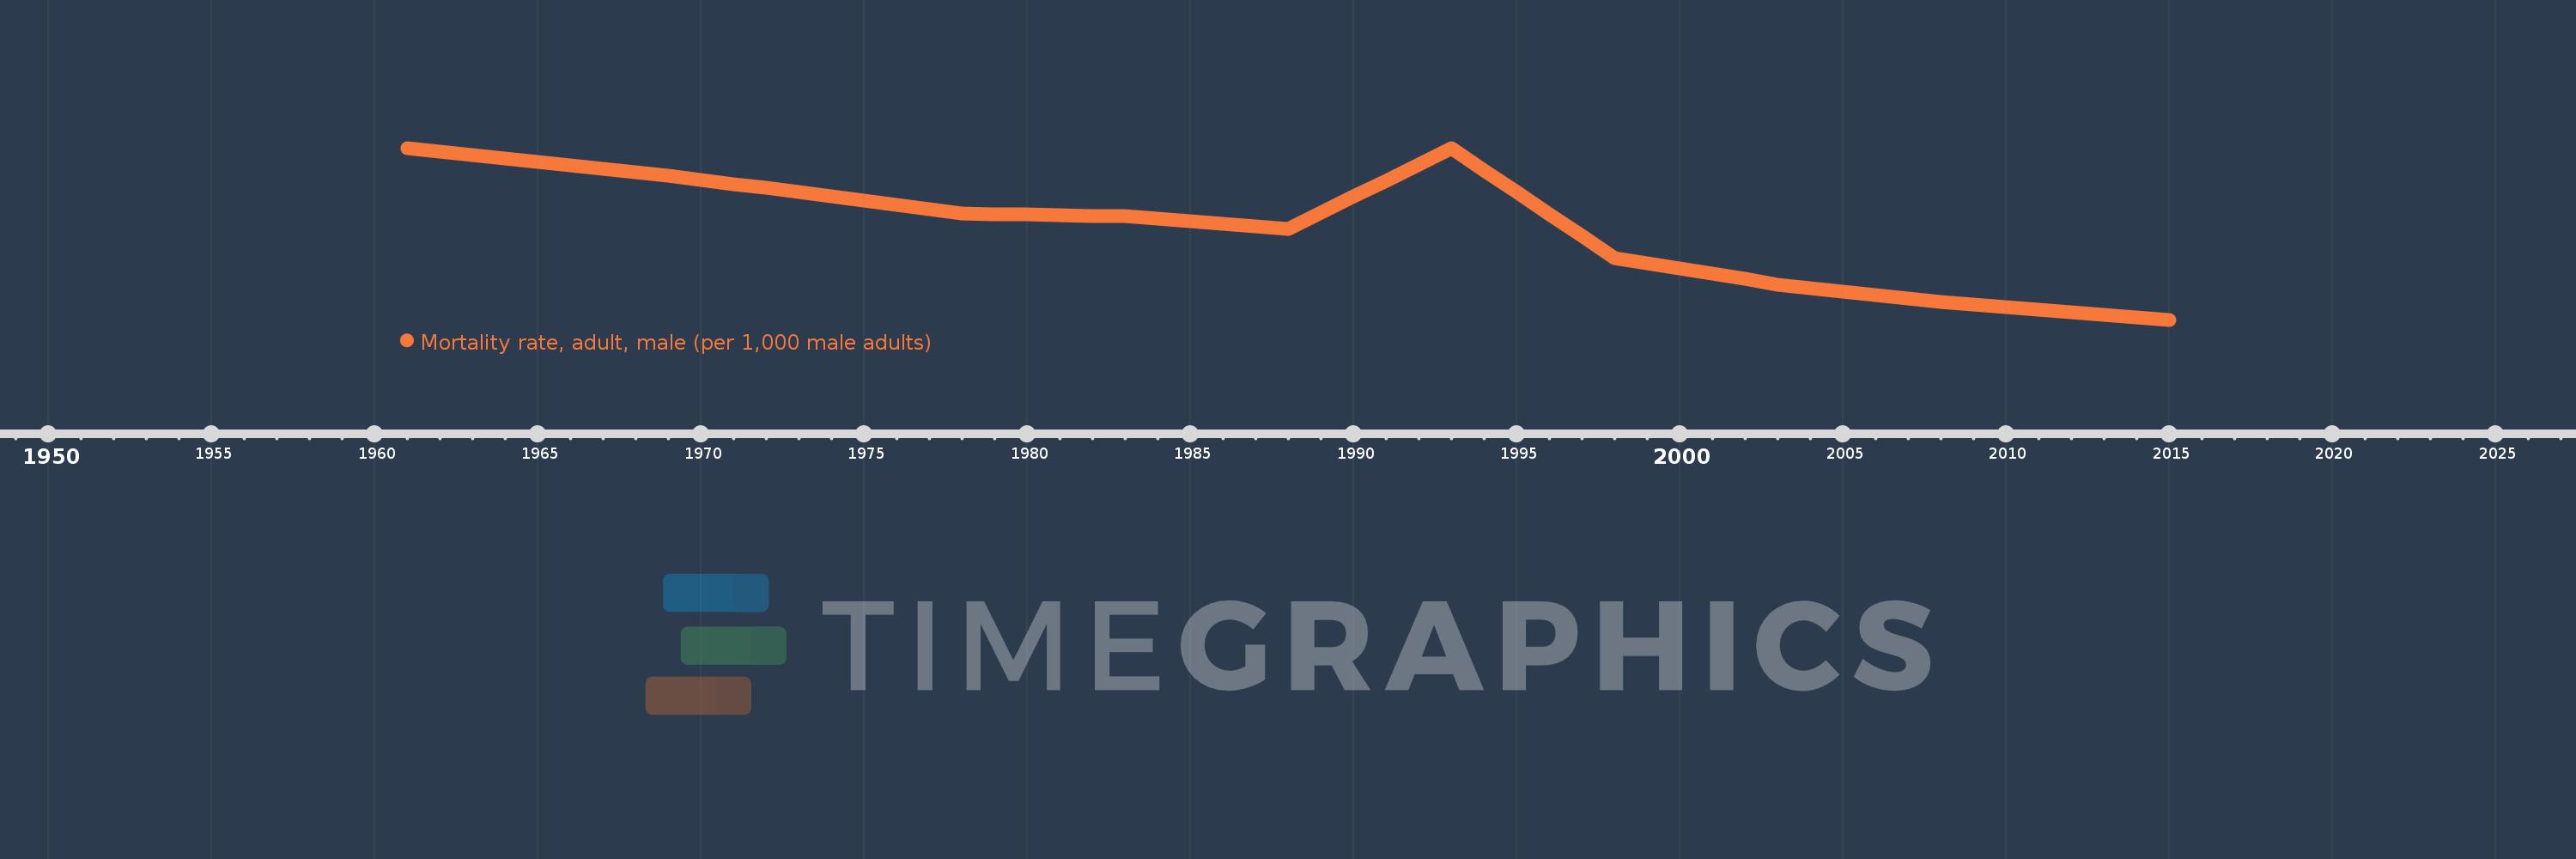
Mortality rate, adult, male (per 1,000 male adults)
2015,2014,2013,2012,2011,2010,2009,2008,2007,2006,2005,2004,2003,2002,2001,2000,1999,1998,1997,1996,1995,1994,1993,1992,1991,1990,1989,1988,1987,1986,1985,1984,1983,1982,1981,1980,1979,1978,1977,1976,1975,1974,1973,1972,1971,1970,1969,1968,1967,1966,1965,1964,1963,1962,1961
This statistics in other country:
AfghanistanAlbaniaAlgeriaAngolaAntigua and BarbudaArab WorldArgentinaArmeniaArubaAustraliaAustriaAzerbaijanBahamas, TheBahrainBangladeshBarbadosBelarusBelgiumBelizeBeninBhutanBoliviaBosnia and HerzegovinaBotswanaBrazilBrunei DarussalamBulgariaBurkina FasoBurundiCabo VerdeCambodiaCameroonCanadaCaribbean small statesCentral African RepublicCentral Europe and the BalticsChadChannel IslandsChileChinaColombiaComorosCongo, Dem. Rep.Congo, Rep.Costa RicaCote d'IvoireCroatiaCubaCuracaoCyprusCzech RepublicDenmarkDjiboutiDominicaDominican RepublicEarly-demographic dividendEast Asia & PacificEast Asia & Pacific (excluding high income)East Asia & Pacific (IDA & IBRD countries)EcuadorEgypt, Arab Rep.El SalvadorEquatorial GuineaEritreaEstoniaEthiopiaEuro areaEurope & Central AsiaEurope & Central Asia (excluding high income)Europe & Central Asia (IDA & IBRD countries)European UnionFijiFinlandFragile and conflict affected situationsFranceFrench PolynesiaGabonGambia, TheGeorgiaGermanyGhanaGreeceGreenlandGrenadaGuamGuatemalaGuineaGuinea-BissauGuyanaHaitiHeavily indebted poor countries (HIPC)High incomeHondurasHong Kong SAR, ChinaHungaryIBRD onlyIcelandIDA & IBRD totalIDA blendIDA onlyIDA totalIndiaIndonesiaIran, Islamic Rep.IraqIrelandIsraelItalyJamaicaJapanJordanKazakhstanKenyaKiribatiKorea, Dem. People’s Rep.Korea, Rep.KuwaitKyrgyz RepublicLao PDRLate-demographic dividendLatin America & Caribbean Latin America & Caribbean (excluding high income)Latin America & the Caribbean (IDA & IBRD countries)LatviaLeast developed countries: UN classificationLebanonLesothoLiberiaLibyaLithuaniaLow & middle incomeLow incomeLower middle incomeLuxembourgMacao SAR, ChinaMacedonia, FYRMadagascarMalawiMalaysiaMaldivesMaliMaltaMarshall IslandsMauritaniaMauritiusMexicoMicronesia, Fed. Sts.Middle East & North AfricaMiddle East & North Africa (excluding high income)Middle East & North Africa (IDA & IBRD countries)Middle incomeMoldovaMongoliaMontenegroMoroccoMozambiqueMyanmarNamibiaNepalNetherlandsNew CaledoniaNew ZealandNicaraguaNigerNigeriaNorth AmericaNorwayOECD membersOmanOther small statesPacific island small statesPakistanPanamaPapua New GuineaParaguayPeruPhilippinesPolandPortugalPost-demographic dividendPre-demographic dividendPuerto RicoQatarRomaniaRussian FederationRwandaSamoaSao Tome and PrincipeSaudi ArabiaSenegalSerbiaSeychellesSierra LeoneSingaporeSlovak RepublicSloveniaSmall statesSolomon IslandsSomaliaSouth AfricaSouth AsiaSouth Asia (IDA & IBRD)South SudanSpainSri LankaSt. Kitts and NevisSt. LuciaSt. Vincent and the GrenadinesSub-Saharan Africa Sub-Saharan Africa (excluding high income)Sub-Saharan Africa (IDA & IBRD countries)SudanSurinameSwazilandSwedenSwitzerlandSyrian Arab RepublicTajikistanTanzaniaThailandTimor-LesteTogoTongaTrinidad and TobagoTunisiaTurkeyTurkmenistanUgandaUkraineUnited Arab EmiratesUnited KingdomUnited StatesUpper middle incomeUruguayUzbekistanVanuatuVenezuela, RBVietnamVirgin Islands (U.S.)West Bank and GazaWorldYemen, Rep.ZambiaZimbabwe Timeline:
This timeline shows a graph from 1961 to 2015 of Bosnia and Herzegovina. No data until 1960. Number of actual observations by date: 55.
Source name:
World Development Indicators
Source organization:
(1) United Nations Population Division. World Population Prospects. New York, United Nations, Department of Economic and Social Affairs (advanced Excel tables). Available at http://esa.un.org/wpp/unpp/panel_population.htm, (2) University of California, Berkeley, and Max Planck Institute for Demographic Research. Human Mortality Database. [ www.mortality.org or www.humanmortality.de].
Categories, topics:
Health, Gender
Last updated:
apr 23, 2017
Indicators value changes by year
Minimum:
129.538
jan 1, 2015
Maximum:
247.839
jan 1, 1961
At the date of observation
Value
Absolute change
Change from previous value
jan 1, 1961
247.839
+247.839
0.0%
jan 1, 1962
245.509
-2.33
-0.94%
jan 1, 1963
243.179
-2.33
-0.95%
jan 1, 1964
240.819
-2.36
-0.97%
jan 1, 1965
238.458
-2.361
-0.98%
jan 1, 1966
236.097
-2.361
-0.99%
jan 1, 1967
233.737
-2.36
-1.0%
jan 1, 1968
231.376
-2.361
-1.01%
jan 1, 1969
228.578
-2.798
-1.21%
jan 1, 1970
225.781
-2.797
-1.22%
jan 1, 1971
222.984
-2.797
-1.24%
jan 1, 1972
220.186
-2.798
-1.25%
jan 1, 1973
217.389
-2.797
-1.27%
jan 1, 1974
214.448
-2.941
-1.35%
jan 1, 1975
211.507
-2.941
-1.37%
jan 1, 1976
208.565
-2.942
-1.39%
jan 1, 1977
205.624
-2.941
-1.41%
jan 1, 1978
202.683
-2.941
-1.43%
jan 1, 1979
202.316
-0.367
-0.18%
jan 1, 1980
201.949
-0.367
-0.18%
jan 1, 1981
201.582
-0.367
-0.18%
jan 1, 1982
201.215
-0.367
-0.18%
jan 1, 1983
200.848
-0.367
-0.18%
jan 1, 1984
199.092
-1.756
-0.87%
jan 1, 1985
197.335
-1.757
-0.88%
jan 1, 1986
195.579
-1.756
-0.89%
jan 1, 1987
193.822
-1.757
-0.9%
jan 1, 1988
192.066
-1.756
-0.91%
jan 1, 1989
203.188
+11.122
5.79%
jan 1, 1990
214.31
+11.122
5.47%
jan 1, 1991
225.431
+11.121
5.19%
jan 1, 1992
236.553
+11.122
4.93%
jan 1, 1993
247.675
+11.122
4.7%
jan 1, 1994
232.518
-15.157
-6.12%
jan 1, 1995
217.362
-15.156
-6.52%
jan 1, 1996
202.206
-15.156
-6.97%
jan 1, 1997
187.049
-15.157
-7.5%
jan 1, 1998
171.893
-15.156
-8.1%
jan 1, 1999
168.29
-3.603
-2.1%
jan 1, 2000
164.687
-3.603
-2.14%
jan 1, 2001
161.084
-3.603
-2.19%
jan 1, 2002
157.481
-3.603
-2.24%
jan 1, 2003
153.878
-3.603
-2.29%
jan 1, 2004
151.408
-2.47
-1.61%
jan 1, 2005
148.939
-2.469
-1.63%
jan 1, 2006
146.47
-2.469
-1.66%
jan 1, 2007
144.001
-2.469
-1.69%
jan 1, 2008
141.531
-2.47
-1.72%
jan 1, 2009
139.815
-1.716
-1.21%
jan 1, 2010
138.099
-1.716
-1.23%
jan 1, 2011
136.382
-1.717
-1.24%
jan 1, 2012
134.666
-1.716
-1.26%
jan 1, 2013
132.95
-1.716
-1.27%
jan 1, 2014
131.244
-1.706
-1.28%
jan 1, 2015
129.538
-1.706
-1.3%
Ranking of countries by current statistics by years


Comments: