29
/
en
AIzaSyAYiBZKx7MnpbEhh9jyipgxe19OcubqV5w
April 1, 2024
226916
Puerto Rico
PRI
true
2
1
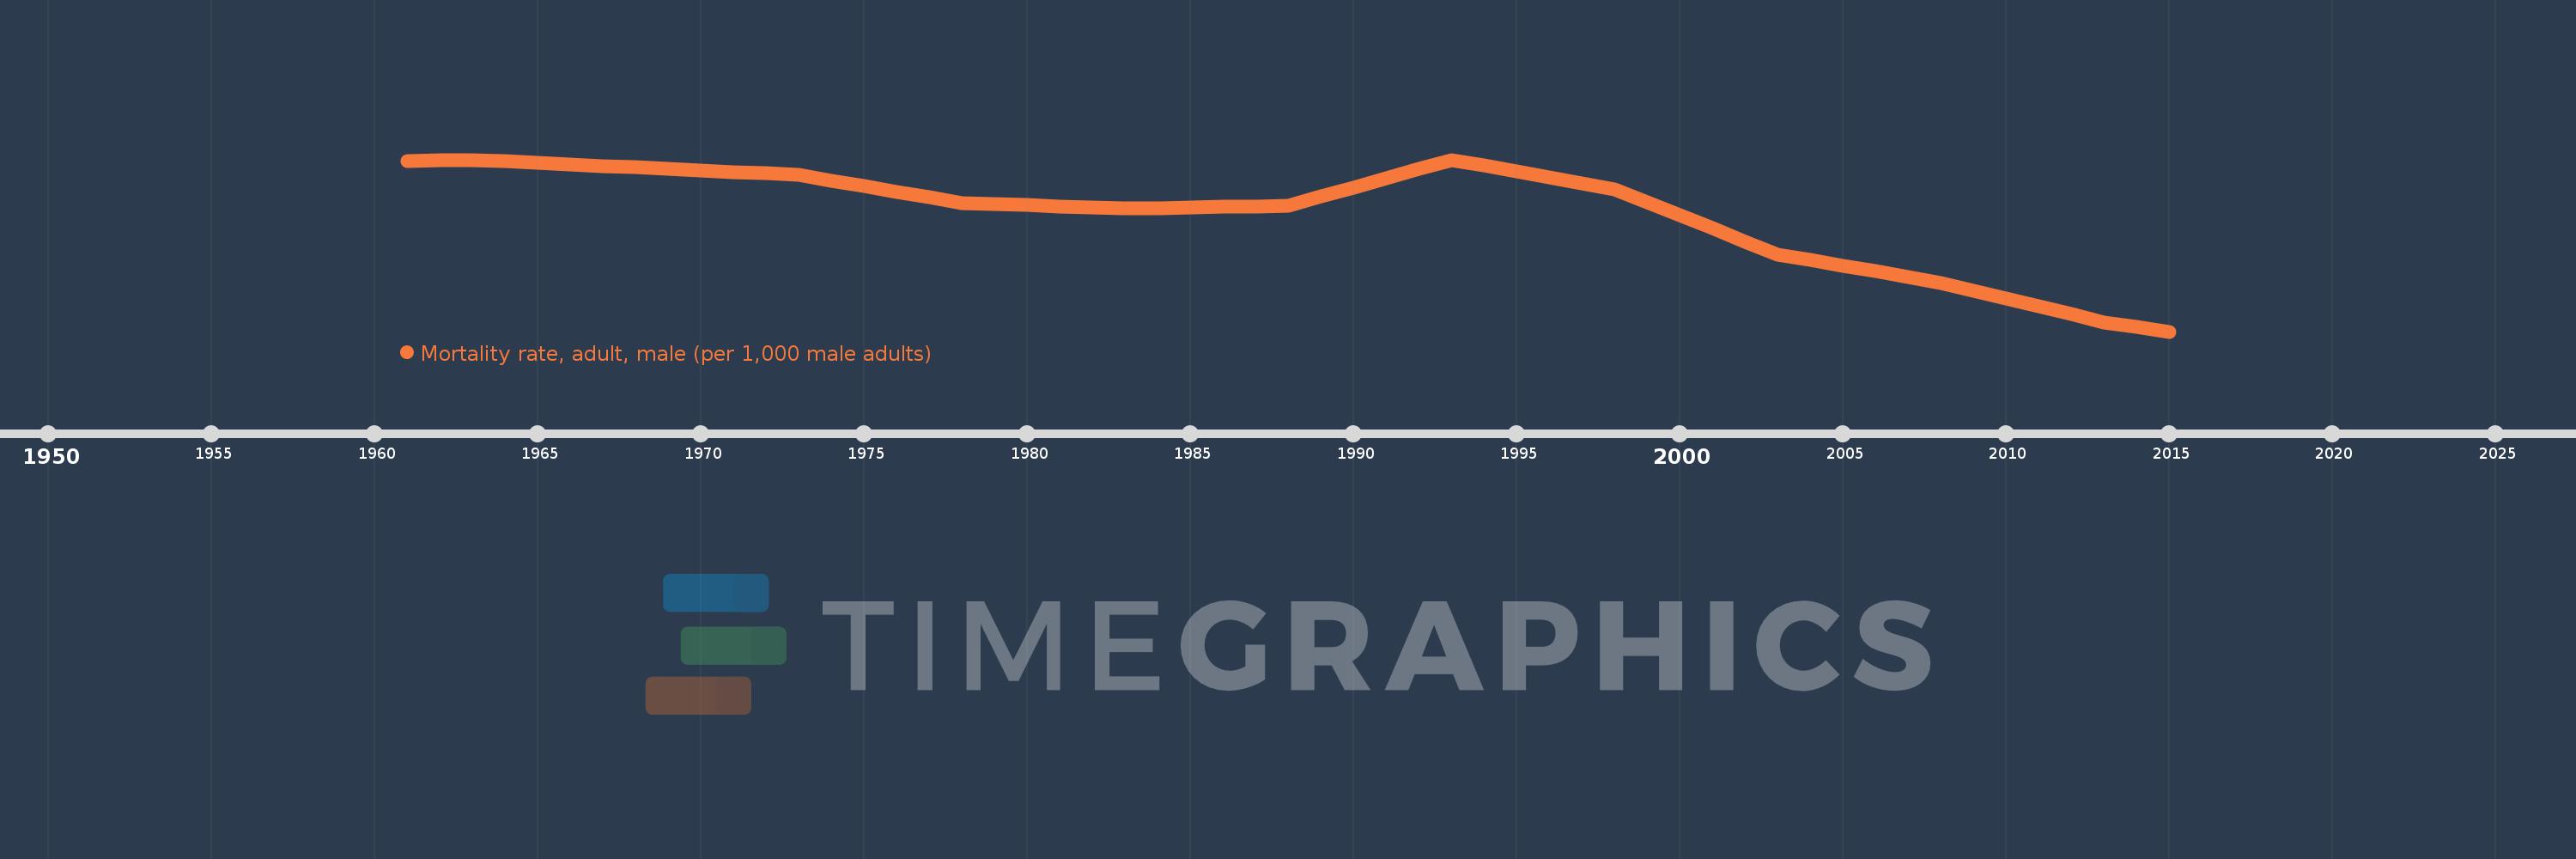
Mortality rate, adult, male (per 1,000 male adults)
2015,2014,2013,2012,2011,2010,2009,2008,2007,2006,2005,2004,2003,2002,2001,2000,1999,1998,1997,1996,1995,1994,1993,1992,1991,1990,1989,1988,1987,1986,1985,1984,1983,1982,1981,1980,1979,1978,1977,1976,1975,1974,1973,1972,1971,1970,1969,1968,1967,1966,1965,1964,1963,1962,1961
This statistics in other country:
AfghanistanAlbaniaAlgeriaAngolaAntigua and BarbudaArab WorldArgentinaArmeniaArubaAustraliaAustriaAzerbaijanBahamas, TheBahrainBangladeshBarbadosBelarusBelgiumBelizeBeninBhutanBoliviaBosnia and HerzegovinaBotswanaBrazilBrunei DarussalamBulgariaBurkina FasoBurundiCabo VerdeCambodiaCameroonCanadaCaribbean small statesCentral African RepublicCentral Europe and the BalticsChadChannel IslandsChileChinaColombiaComorosCongo, Dem. Rep.Congo, Rep.Costa RicaCote d'IvoireCroatiaCubaCuracaoCyprusCzech RepublicDenmarkDjiboutiDominicaDominican RepublicEarly-demographic dividendEast Asia & PacificEast Asia & Pacific (excluding high income)East Asia & Pacific (IDA & IBRD countries)EcuadorEgypt, Arab Rep.El SalvadorEquatorial GuineaEritreaEstoniaEthiopiaEuro areaEurope & Central AsiaEurope & Central Asia (excluding high income)Europe & Central Asia (IDA & IBRD countries)European UnionFijiFinlandFragile and conflict affected situationsFranceFrench PolynesiaGabonGambia, TheGeorgiaGermanyGhanaGreeceGreenlandGrenadaGuamGuatemalaGuineaGuinea-BissauGuyanaHaitiHeavily indebted poor countries (HIPC)High incomeHondurasHong Kong SAR, ChinaHungaryIBRD onlyIcelandIDA & IBRD totalIDA blendIDA onlyIDA totalIndiaIndonesiaIran, Islamic Rep.IraqIrelandIsraelItalyJamaicaJapanJordanKazakhstanKenyaKiribatiKorea, Dem. People’s Rep.Korea, Rep.KuwaitKyrgyz RepublicLao PDRLate-demographic dividendLatin America & Caribbean Latin America & Caribbean (excluding high income)Latin America & the Caribbean (IDA & IBRD countries)LatviaLeast developed countries: UN classificationLebanonLesothoLiberiaLibyaLithuaniaLow & middle incomeLow incomeLower middle incomeLuxembourgMacao SAR, ChinaMacedonia, FYRMadagascarMalawiMalaysiaMaldivesMaliMaltaMarshall IslandsMauritaniaMauritiusMexicoMicronesia, Fed. Sts.Middle East & North AfricaMiddle East & North Africa (excluding high income)Middle East & North Africa (IDA & IBRD countries)Middle incomeMoldovaMongoliaMontenegroMoroccoMozambiqueMyanmarNamibiaNepalNetherlandsNew CaledoniaNew ZealandNicaraguaNigerNigeriaNorth AmericaNorwayOECD membersOmanOther small statesPacific island small statesPakistanPanamaPapua New GuineaParaguayPeruPhilippinesPolandPortugalPost-demographic dividendPre-demographic dividendPuerto RicoQatarRomaniaRussian FederationRwandaSamoaSao Tome and PrincipeSaudi ArabiaSenegalSerbiaSeychellesSierra LeoneSingaporeSlovak RepublicSloveniaSmall statesSolomon IslandsSomaliaSouth AfricaSouth AsiaSouth Asia (IDA & IBRD)South SudanSpainSri LankaSt. Kitts and NevisSt. LuciaSt. Vincent and the GrenadinesSub-Saharan Africa Sub-Saharan Africa (excluding high income)Sub-Saharan Africa (IDA & IBRD countries)SudanSurinameSwazilandSwedenSwitzerlandSyrian Arab RepublicTajikistanTanzaniaThailandTimor-LesteTogoTongaTrinidad and TobagoTunisiaTurkeyTurkmenistanUgandaUkraineUnited Arab EmiratesUnited KingdomUnited StatesUpper middle incomeUruguayUzbekistanVanuatuVenezuela, RBVietnamVirgin Islands (U.S.)West Bank and GazaWorldYemen, Rep.ZambiaZimbabwe Timeline:
This timeline shows a graph from 1961 to 2015 of Puerto Rico. No data until 1960. Number of actual observations by date: 55.
Source name:
World Development Indicators
Source organization:
(1) United Nations Population Division. World Population Prospects. New York, United Nations, Department of Economic and Social Affairs (advanced Excel tables). Available at http://esa.un.org/wpp/unpp/panel_population.htm, (2) University of California, Berkeley, and Max Planck Institute for Demographic Research. Human Mortality Database. [ www.mortality.org or www.humanmortality.de].
Categories, topics:
Health, Gender
Last updated:
apr 23, 2017
Indicators value changes by year
Maximum:
240.65
jan 1, 1963
At the date of observation
Value
Absolute change
Change from previous value
jan 1, 1961
239.967
+239.967
0.0%
jan 1, 1962
240.309
+0.342
0.14%
jan 1, 1963
240.65
+0.341
0.14%
jan 1, 1964
239.777
-0.873
-0.36%
jan 1, 1965
238.903
-0.874
-0.36%
jan 1, 1966
238.03
-0.873
-0.37%
jan 1, 1967
237.157
-0.873
-0.37%
jan 1, 1968
236.283
-0.874
-0.37%
jan 1, 1969
235.432
-0.851
-0.36%
jan 1, 1970
234.581
-0.851
-0.36%
jan 1, 1971
233.73
-0.851
-0.36%
jan 1, 1972
232.88
-0.85
-0.36%
jan 1, 1973
232.029
-0.851
-0.37%
jan 1, 1974
228.839
-3.19
-1.37%
jan 1, 1975
225.649
-3.19
-1.39%
jan 1, 1976
222.459
-3.19
-1.41%
jan 1, 1977
219.269
-3.19
-1.43%
jan 1, 1978
216.079
-3.19
-1.45%
jan 1, 1979
215.397
-0.682
-0.32%
jan 1, 1980
214.715
-0.682
-0.32%
jan 1, 1981
214.033
-0.682
-0.32%
jan 1, 1982
213.35
-0.683
-0.32%
jan 1, 1983
212.668
-0.682
-0.32%
jan 1, 1984
213.015
+0.347
0.16%
jan 1, 1985
213.362
+0.347
0.16%
jan 1, 1986
213.709
+0.347
0.16%
jan 1, 1987
214.056
+0.347
0.16%
jan 1, 1988
214.403
+0.347
0.16%
jan 1, 1989
219.647
+5.244
2.45%
jan 1, 1990
224.891
+5.244
2.39%
jan 1, 1991
230.136
+5.245
2.33%
jan 1, 1992
235.38
+5.244
2.28%
jan 1, 1993
240.624
+5.244
2.23%
jan 1, 1994
237.244
-3.38
-1.4%
jan 1, 1995
233.865
-3.379
-1.42%
jan 1, 1996
230.485
-3.38
-1.45%
jan 1, 1997
227.105
-3.38
-1.47%
jan 1, 1998
223.725
-3.38
-1.49%
jan 1, 1999
216.281
-7.444
-3.33%
jan 1, 2000
208.837
-7.444
-3.44%
jan 1, 2001
201.393
-7.444
-3.56%
jan 1, 2002
193.95
-7.443
-3.7%
jan 1, 2003
186.506
-7.444
-3.84%
jan 1, 2004
183.278
-3.228
-1.73%
jan 1, 2005
180.051
-3.227
-1.76%
jan 1, 2006
176.824
-3.227
-1.79%
jan 1, 2007
173.597
-3.227
-1.82%
jan 1, 2008
170.37
-3.227
-1.86%
jan 1, 2009
165.848
-4.522
-2.65%
jan 1, 2010
161.327
-4.521
-2.73%
jan 1, 2011
156.806
-4.521
-2.8%
jan 1, 2012
152.285
-4.521
-2.88%
jan 1, 2013
147.764
-4.521
-2.97%
jan 1, 2014
145.082
-2.682
-1.82%
jan 1, 2015
142.4
-2.682
-1.85%
Ranking of countries by current statistics by years


Comments: