29
/
en
AIzaSyAYiBZKx7MnpbEhh9jyipgxe19OcubqV5w
April 1, 2024
27503
East Asia & Pacific
EAS
false
2
1
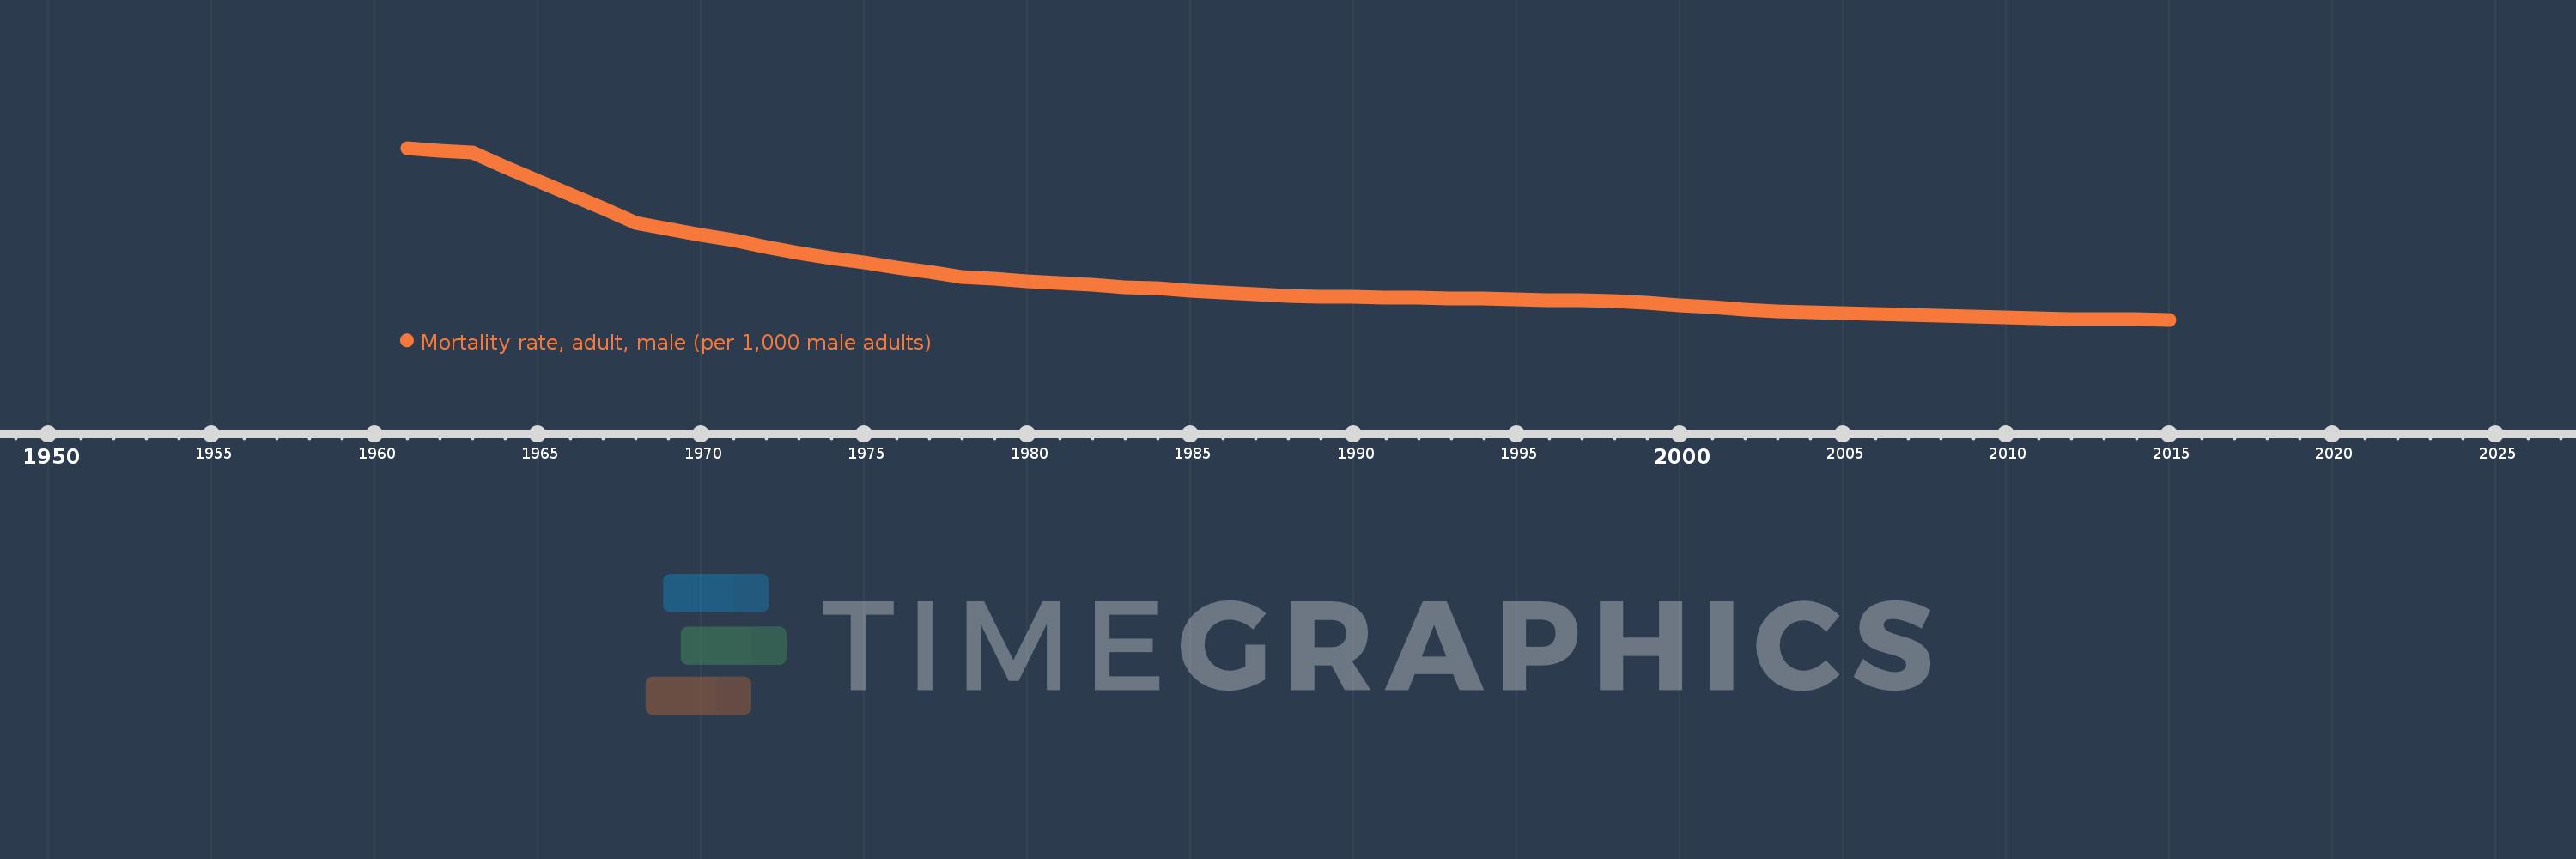
Mortality rate, adult, male (per 1,000 male adults)
2015,2014,2013,2012,2011,2010,2009,2008,2007,2006,2005,2004,2003,2002,2001,2000,1999,1998,1997,1996,1995,1994,1993,1992,1991,1990,1989,1988,1987,1986,1985,1984,1983,1982,1981,1980,1979,1978,1977,1976,1975,1974,1973,1972,1971,1970,1969,1968,1967,1966,1965,1964,1963,1962,1961
This statistics in other country:
AfghanistanAlbaniaAlgeriaAngolaAntigua and BarbudaArab WorldArgentinaArmeniaArubaAustraliaAustriaAzerbaijanBahamas, TheBahrainBangladeshBarbadosBelarusBelgiumBelizeBeninBhutanBoliviaBosnia and HerzegovinaBotswanaBrazilBrunei DarussalamBulgariaBurkina FasoBurundiCabo VerdeCambodiaCameroonCanadaCaribbean small statesCentral African RepublicCentral Europe and the BalticsChadChannel IslandsChileChinaColombiaComorosCongo, Dem. Rep.Congo, Rep.Costa RicaCote d'IvoireCroatiaCubaCuracaoCyprusCzech RepublicDenmarkDjiboutiDominicaDominican RepublicEarly-demographic dividendEast Asia & PacificEast Asia & Pacific (excluding high income)East Asia & Pacific (IDA & IBRD countries)EcuadorEgypt, Arab Rep.El SalvadorEquatorial GuineaEritreaEstoniaEthiopiaEuro areaEurope & Central AsiaEurope & Central Asia (excluding high income)Europe & Central Asia (IDA & IBRD countries)European UnionFijiFinlandFragile and conflict affected situationsFranceFrench PolynesiaGabonGambia, TheGeorgiaGermanyGhanaGreeceGreenlandGrenadaGuamGuatemalaGuineaGuinea-BissauGuyanaHaitiHeavily indebted poor countries (HIPC)High incomeHondurasHong Kong SAR, ChinaHungaryIBRD onlyIcelandIDA & IBRD totalIDA blendIDA onlyIDA totalIndiaIndonesiaIran, Islamic Rep.IraqIrelandIsraelItalyJamaicaJapanJordanKazakhstanKenyaKiribatiKorea, Dem. People’s Rep.Korea, Rep.KuwaitKyrgyz RepublicLao PDRLate-demographic dividendLatin America & Caribbean Latin America & Caribbean (excluding high income)Latin America & the Caribbean (IDA & IBRD countries)LatviaLeast developed countries: UN classificationLebanonLesothoLiberiaLibyaLithuaniaLow & middle incomeLow incomeLower middle incomeLuxembourgMacao SAR, ChinaMacedonia, FYRMadagascarMalawiMalaysiaMaldivesMaliMaltaMarshall IslandsMauritaniaMauritiusMexicoMicronesia, Fed. Sts.Middle East & North AfricaMiddle East & North Africa (excluding high income)Middle East & North Africa (IDA & IBRD countries)Middle incomeMoldovaMongoliaMontenegroMoroccoMozambiqueMyanmarNamibiaNepalNetherlandsNew CaledoniaNew ZealandNicaraguaNigerNigeriaNorth AmericaNorwayOECD membersOmanOther small statesPacific island small statesPakistanPanamaPapua New GuineaParaguayPeruPhilippinesPolandPortugalPost-demographic dividendPre-demographic dividendPuerto RicoQatarRomaniaRussian FederationRwandaSamoaSao Tome and PrincipeSaudi ArabiaSenegalSerbiaSeychellesSierra LeoneSingaporeSlovak RepublicSloveniaSmall statesSolomon IslandsSomaliaSouth AfricaSouth AsiaSouth Asia (IDA & IBRD)South SudanSpainSri LankaSt. Kitts and NevisSt. LuciaSt. Vincent and the GrenadinesSub-Saharan Africa Sub-Saharan Africa (excluding high income)Sub-Saharan Africa (IDA & IBRD countries)SudanSurinameSwazilandSwedenSwitzerlandSyrian Arab RepublicTajikistanTanzaniaThailandTimor-LesteTogoTongaTrinidad and TobagoTunisiaTurkeyTurkmenistanUgandaUkraineUnited Arab EmiratesUnited KingdomUnited StatesUpper middle incomeUruguayUzbekistanVanuatuVenezuela, RBVietnamVirgin Islands (U.S.)West Bank and GazaWorldYemen, Rep.ZambiaZimbabwe Timeline:
This timeline shows a graph from 1961 to 2015 of East Asia & Pacific. No data until 1960. Number of actual observations by date: 55.
Source name:
World Development Indicators
Source organization:
(1) United Nations Population Division. World Population Prospects. New York, United Nations, Department of Economic and Social Affairs (advanced Excel tables). Available at http://esa.un.org/wpp/unpp/panel_population.htm, (2) University of California, Berkeley, and Max Planck Institute for Demographic Research. Human Mortality Database. [ www.mortality.org or www.humanmortality.de].
Categories, topics:
Health, Gender
Last updated:
apr 23, 2017
Indicators value changes by year
Minimum:
131.239
jan 1, 2015
Maximum:
443.258
jan 1, 1961
At the date of observation
Value
Absolute change
Change from previous value
jan 1, 1961
443.258
+443.258
0.0%
jan 1, 1962
438.477
-4.781
-1.08%
jan 1, 1963
434.872
-3.605
-0.82%
jan 1, 1964
408.798
-26.074
-6.0%
jan 1, 1965
383.408
-25.39
-6.21%
jan 1, 1966
358.269
-25.139
-6.56%
jan 1, 1967
332.966
-25.304
-7.06%
jan 1, 1968
307.617
-25.348
-7.61%
jan 1, 1969
296.84
-10.778
-3.5%
jan 1, 1970
285.898
-10.941
-3.69%
jan 1, 1971
275.097
-10.801
-3.78%
jan 1, 1972
263.393
-11.704
-4.25%
jan 1, 1973
252.281
-11.112
-4.22%
jan 1, 1974
243.801
-8.48
-3.36%
jan 1, 1975
235.087
-8.713
-3.57%
jan 1, 1976
226.407
-8.681
-3.69%
jan 1, 1977
217.699
-8.707
-3.85%
jan 1, 1978
208.858
-8.842
-4.06%
jan 1, 1979
205.076
-3.781
-1.81%
jan 1, 1980
201.334
-3.743
-1.82%
jan 1, 1981
197.775
-3.559
-1.77%
jan 1, 1982
194.186
-3.589
-1.81%
jan 1, 1983
190.618
-3.568
-1.84%
jan 1, 1984
187.733
-2.885
-1.51%
jan 1, 1985
184.416
-3.317
-1.77%
jan 1, 1986
181.086
-3.33
-1.81%
jan 1, 1987
177.813
-3.274
-1.81%
jan 1, 1988
174.489
-3.323
-1.87%
jan 1, 1989
173.638
-0.852
-0.49%
jan 1, 1990
172.621
-1.017
-0.59%
jan 1, 1991
171.722
-0.899
-0.52%
jan 1, 1992
170.868
-0.854
-0.5%
jan 1, 1993
170.107
-0.761
-0.45%
jan 1, 1994
169.076
-1.031
-0.61%
jan 1, 1995
167.96
-1.116
-0.66%
jan 1, 1996
167.199
-0.76
-0.45%
jan 1, 1997
166.026
-1.174
-0.7%
jan 1, 1998
165.089
-0.936
-0.56%
jan 1, 1999
161.633
-3.456
-2.09%
jan 1, 2000
158.04
-3.593
-2.22%
jan 1, 2001
154.079
-3.961
-2.51%
jan 1, 2002
150.173
-3.906
-2.54%
jan 1, 2003
146.242
-3.931
-2.62%
jan 1, 2004
144.713
-1.529
-1.05%
jan 1, 2005
142.913
-1.801
-1.24%
jan 1, 2006
141.378
-1.534
-1.07%
jan 1, 2007
139.736
-1.642
-1.16%
jan 1, 2008
138.197
-1.539
-1.1%
jan 1, 2009
136.705
-1.492
-1.08%
jan 1, 2010
135.327
-1.378
-1.01%
jan 1, 2011
133.921
-1.405
-1.04%
jan 1, 2012
132.663
-1.258
-0.94%
jan 1, 2013
131.607
-1.056
-0.8%
jan 1, 2014
132.825
+1.218
0.93%
jan 1, 2015
131.239
-1.586
-1.19%
Ranking of countries by current statistics by years


Comments: