29
/
en
AIzaSyAYiBZKx7MnpbEhh9jyipgxe19OcubqV5w
April 1, 2024
277978
Uruguay
URY
true
2
1
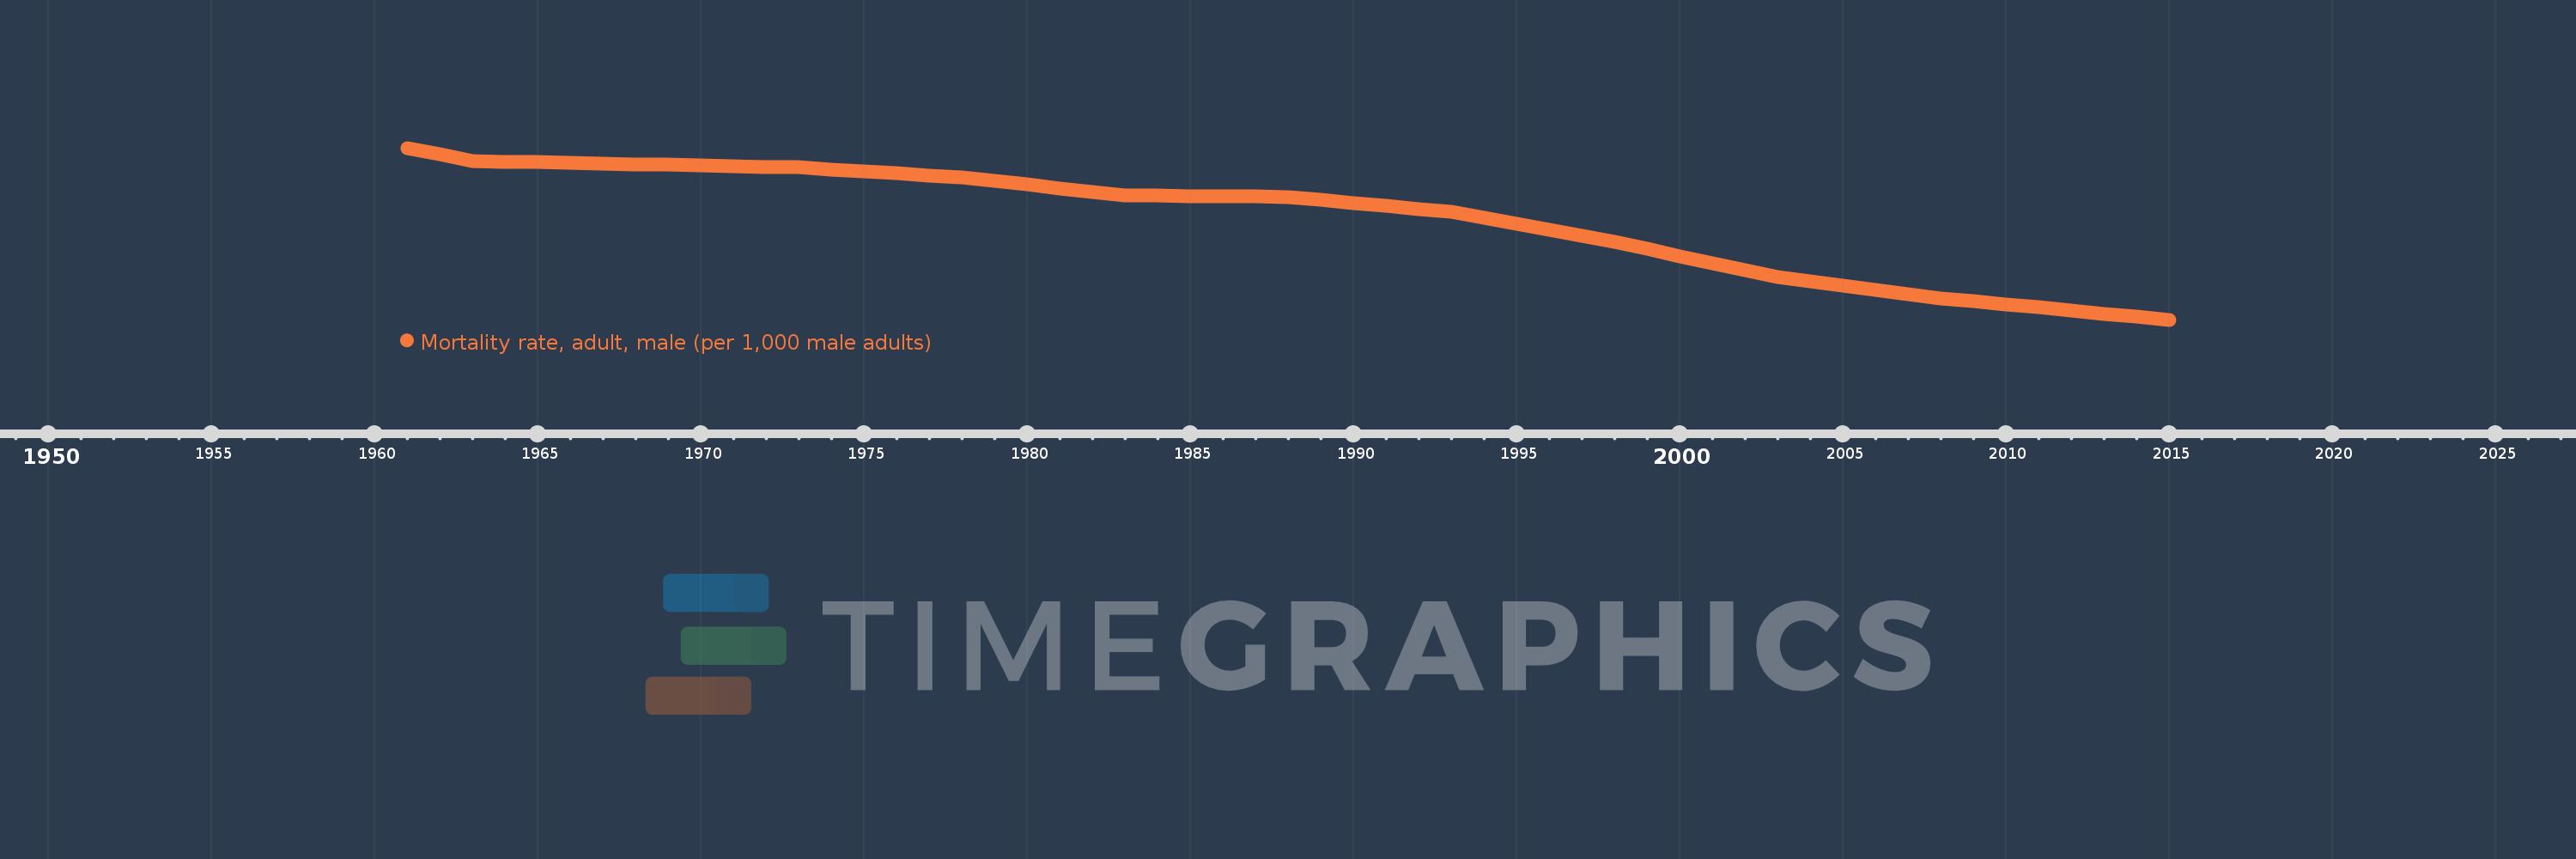
Mortality rate, adult, male (per 1,000 male adults)
2015,2014,2013,2012,2011,2010,2009,2008,2007,2006,2005,2004,2003,2002,2001,2000,1999,1998,1997,1996,1995,1994,1993,1992,1991,1990,1989,1988,1987,1986,1985,1984,1983,1982,1981,1980,1979,1978,1977,1976,1975,1974,1973,1972,1971,1970,1969,1968,1967,1966,1965,1964,1963,1962,1961
This statistics in other country:
AfghanistanAlbaniaAlgeriaAngolaAntigua and BarbudaArab WorldArgentinaArmeniaArubaAustraliaAustriaAzerbaijanBahamas, TheBahrainBangladeshBarbadosBelarusBelgiumBelizeBeninBhutanBoliviaBosnia and HerzegovinaBotswanaBrazilBrunei DarussalamBulgariaBurkina FasoBurundiCabo VerdeCambodiaCameroonCanadaCaribbean small statesCentral African RepublicCentral Europe and the BalticsChadChannel IslandsChileChinaColombiaComorosCongo, Dem. Rep.Congo, Rep.Costa RicaCote d'IvoireCroatiaCubaCuracaoCyprusCzech RepublicDenmarkDjiboutiDominicaDominican RepublicEarly-demographic dividendEast Asia & PacificEast Asia & Pacific (excluding high income)East Asia & Pacific (IDA & IBRD countries)EcuadorEgypt, Arab Rep.El SalvadorEquatorial GuineaEritreaEstoniaEthiopiaEuro areaEurope & Central AsiaEurope & Central Asia (excluding high income)Europe & Central Asia (IDA & IBRD countries)European UnionFijiFinlandFragile and conflict affected situationsFranceFrench PolynesiaGabonGambia, TheGeorgiaGermanyGhanaGreeceGreenlandGrenadaGuamGuatemalaGuineaGuinea-BissauGuyanaHaitiHeavily indebted poor countries (HIPC)High incomeHondurasHong Kong SAR, ChinaHungaryIBRD onlyIcelandIDA & IBRD totalIDA blendIDA onlyIDA totalIndiaIndonesiaIran, Islamic Rep.IraqIrelandIsraelItalyJamaicaJapanJordanKazakhstanKenyaKiribatiKorea, Dem. People’s Rep.Korea, Rep.KuwaitKyrgyz RepublicLao PDRLate-demographic dividendLatin America & Caribbean Latin America & Caribbean (excluding high income)Latin America & the Caribbean (IDA & IBRD countries)LatviaLeast developed countries: UN classificationLebanonLesothoLiberiaLibyaLithuaniaLow & middle incomeLow incomeLower middle incomeLuxembourgMacao SAR, ChinaMacedonia, FYRMadagascarMalawiMalaysiaMaldivesMaliMaltaMarshall IslandsMauritaniaMauritiusMexicoMicronesia, Fed. Sts.Middle East & North AfricaMiddle East & North Africa (excluding high income)Middle East & North Africa (IDA & IBRD countries)Middle incomeMoldovaMongoliaMontenegroMoroccoMozambiqueMyanmarNamibiaNepalNetherlandsNew CaledoniaNew ZealandNicaraguaNigerNigeriaNorth AmericaNorwayOECD membersOmanOther small statesPacific island small statesPakistanPanamaPapua New GuineaParaguayPeruPhilippinesPolandPortugalPost-demographic dividendPre-demographic dividendPuerto RicoQatarRomaniaRussian FederationRwandaSamoaSao Tome and PrincipeSaudi ArabiaSenegalSerbiaSeychellesSierra LeoneSingaporeSlovak RepublicSloveniaSmall statesSolomon IslandsSomaliaSouth AfricaSouth AsiaSouth Asia (IDA & IBRD)South SudanSpainSri LankaSt. Kitts and NevisSt. LuciaSt. Vincent and the GrenadinesSub-Saharan Africa Sub-Saharan Africa (excluding high income)Sub-Saharan Africa (IDA & IBRD countries)SudanSurinameSwazilandSwedenSwitzerlandSyrian Arab RepublicTajikistanTanzaniaThailandTimor-LesteTogoTongaTrinidad and TobagoTunisiaTurkeyTurkmenistanUgandaUkraineUnited Arab EmiratesUnited KingdomUnited StatesUpper middle incomeUruguayUzbekistanVanuatuVenezuela, RBVietnamVirgin Islands (U.S.)West Bank and GazaWorldYemen, Rep.ZambiaZimbabwe Timeline:
This timeline shows a graph from 1961 to 2015 of Uruguay. No data until 1960. Number of actual observations by date: 55.
Source name:
World Development Indicators
Source organization:
(1) United Nations Population Division. World Population Prospects. New York, United Nations, Department of Economic and Social Affairs (advanced Excel tables). Available at http://esa.un.org/wpp/unpp/panel_population.htm, (2) University of California, Berkeley, and Max Planck Institute for Demographic Research. Human Mortality Database. [ www.mortality.org or www.humanmortality.de].
Categories, topics:
Health, Gender
Last updated:
apr 23, 2017
Indicators value changes by year
Minimum:
136.475
jan 1, 2015
Maximum:
226.933
jan 1, 1961
At the date of observation
Value
Absolute change
Change from previous value
jan 1, 1961
226.933
+226.933
0.0%
jan 1, 1962
223.502
-3.431
-1.51%
jan 1, 1963
220.071
-3.431
-1.54%
jan 1, 1964
219.737
-0.334
-0.15%
jan 1, 1965
219.404
-0.333
-0.15%
jan 1, 1966
219.07
-0.334
-0.15%
jan 1, 1967
218.736
-0.334
-0.15%
jan 1, 1968
218.403
-0.333
-0.15%
jan 1, 1969
218.058
-0.345
-0.16%
jan 1, 1970
217.713
-0.345
-0.16%
jan 1, 1971
217.369
-0.344
-0.16%
jan 1, 1972
217.024
-0.345
-0.16%
jan 1, 1973
216.679
-0.345
-0.16%
jan 1, 1974
215.616
-1.063
-0.49%
jan 1, 1975
214.552
-1.064
-0.49%
jan 1, 1976
213.489
-1.063
-0.5%
jan 1, 1977
212.426
-1.063
-0.5%
jan 1, 1978
211.362
-1.064
-0.5%
jan 1, 1979
209.483
-1.879
-0.89%
jan 1, 1980
207.604
-1.879
-0.9%
jan 1, 1981
205.725
-1.879
-0.91%
jan 1, 1982
203.846
-1.879
-0.91%
jan 1, 1983
201.967
-1.879
-0.92%
jan 1, 1984
201.815
-0.152
-0.08%
jan 1, 1985
201.664
-0.151
-0.07%
jan 1, 1986
201.513
-0.151
-0.07%
jan 1, 1987
201.361
-0.152
-0.08%
jan 1, 1988
201.21
-0.151
-0.07%
jan 1, 1989
199.601
-1.609
-0.8%
jan 1, 1990
197.993
-1.608
-0.81%
jan 1, 1991
196.384
-1.609
-0.81%
jan 1, 1992
194.775
-1.609
-0.82%
jan 1, 1993
193.167
-1.608
-0.83%
jan 1, 1994
190.035
-3.132
-1.62%
jan 1, 1995
186.903
-3.132
-1.65%
jan 1, 1996
183.771
-3.132
-1.68%
jan 1, 1997
180.639
-3.132
-1.7%
jan 1, 1998
177.507
-3.132
-1.73%
jan 1, 1999
173.765
-3.742
-2.11%
jan 1, 2000
170.023
-3.742
-2.15%
jan 1, 2001
166.281
-3.742
-2.2%
jan 1, 2002
162.539
-3.742
-2.25%
jan 1, 2003
158.797
-3.742
-2.3%
jan 1, 2004
156.607
-2.19
-1.38%
jan 1, 2005
154.417
-2.19
-1.4%
jan 1, 2006
152.226
-2.191
-1.42%
jan 1, 2007
150.036
-2.19
-1.44%
jan 1, 2008
147.846
-2.19
-1.46%
jan 1, 2009
146.218
-1.628
-1.1%
jan 1, 2010
144.59
-1.628
-1.11%
jan 1, 2011
142.963
-1.627
-1.13%
jan 1, 2012
141.335
-1.628
-1.14%
jan 1, 2013
139.707
-1.628
-1.15%
jan 1, 2014
138.091
-1.616
-1.16%
jan 1, 2015
136.475
-1.616
-1.17%
Ranking of countries by current statistics by years


Comments: