29
/
en
AIzaSyAYiBZKx7MnpbEhh9jyipgxe19OcubqV5w
April 1, 2024
52839
OECD members
OED
false
2
1
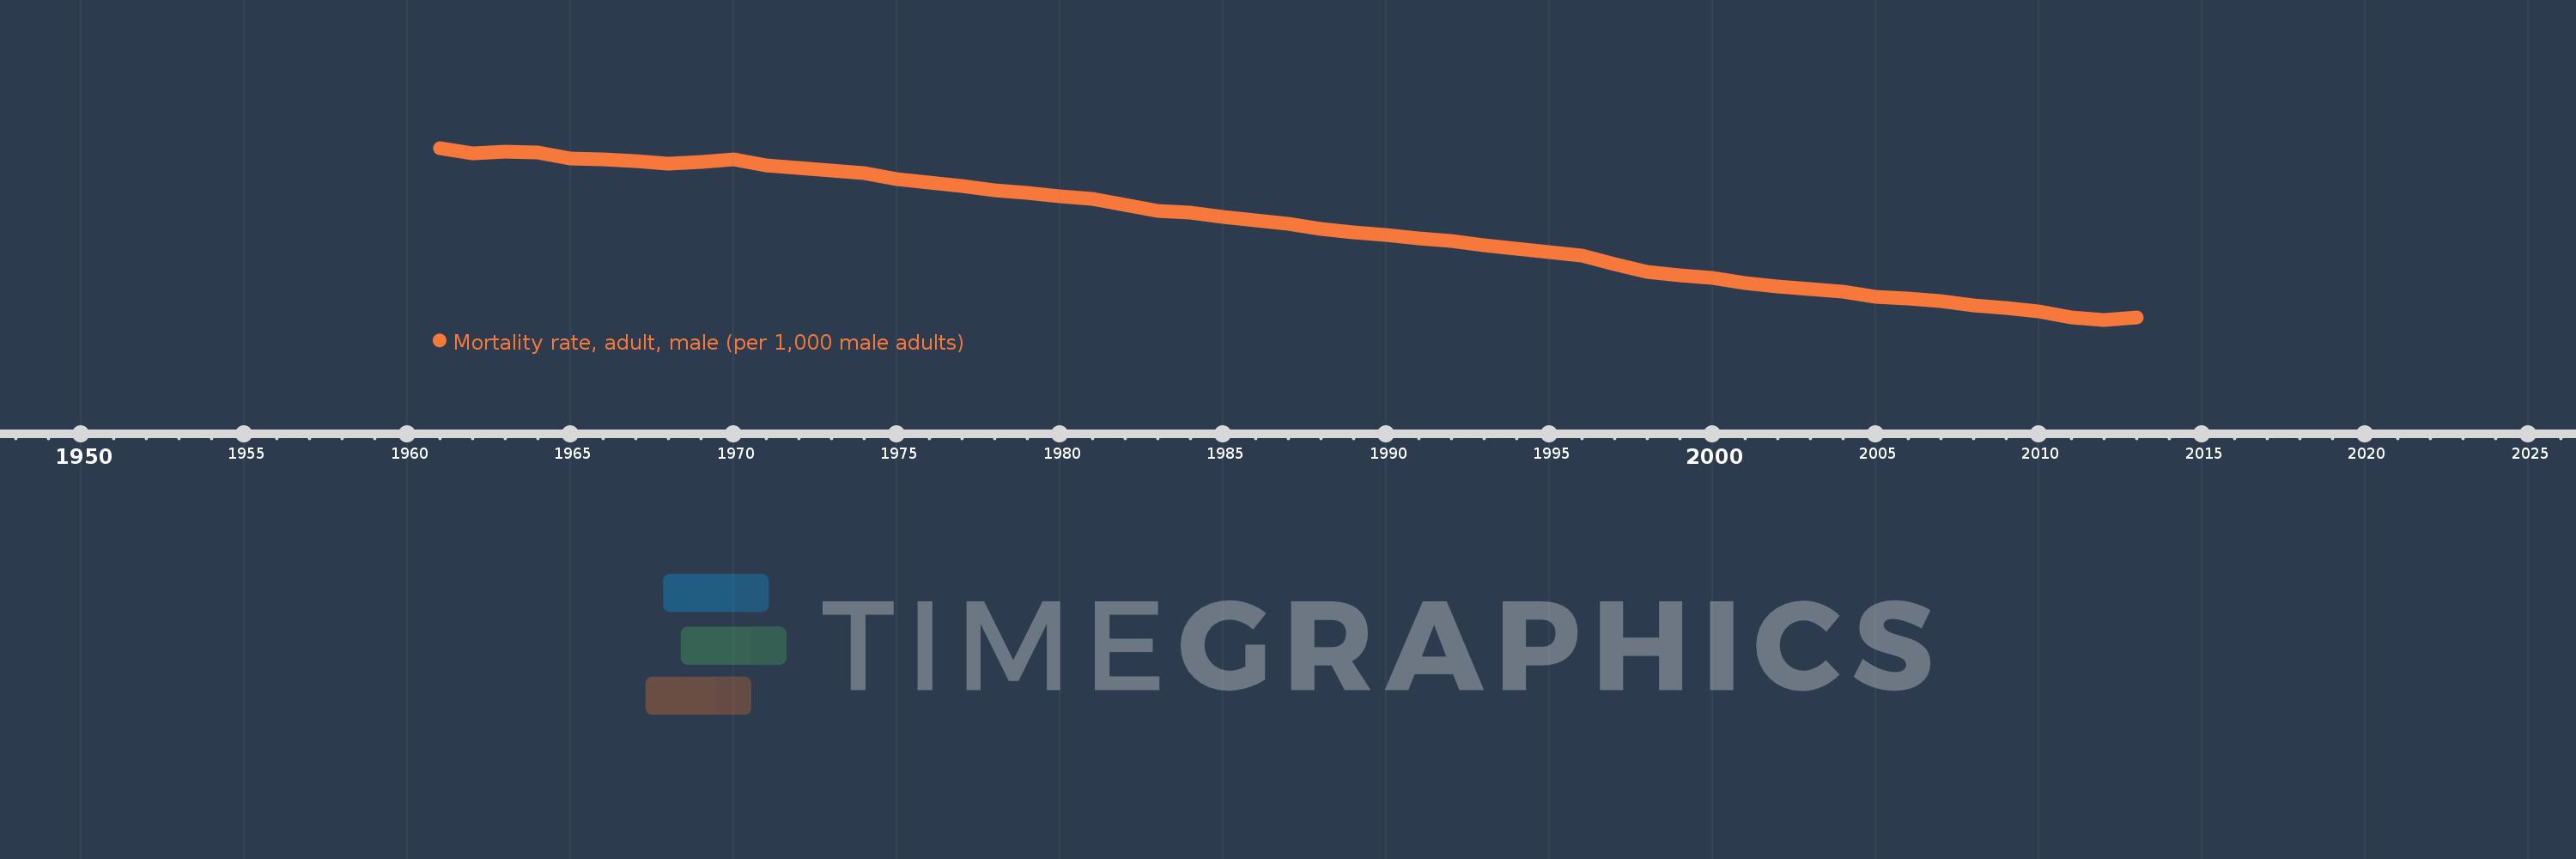
Mortality rate, adult, male (per 1,000 male adults)
2013,2012,2011,2010,2009,2008,2007,2006,2005,2004,2003,2002,2001,2000,1999,1998,1997,1996,1995,1994,1993,1992,1991,1990,1989,1988,1987,1986,1985,1984,1983,1982,1981,1980,1979,1978,1977,1976,1975,1974,1973,1972,1971,1970,1969,1968,1967,1966,1965,1964,1963,1962,1961
This statistics in other country:
AfghanistanAlbaniaAlgeriaAngolaAntigua and BarbudaArab WorldArgentinaArmeniaArubaAustraliaAustriaAzerbaijanBahamas, TheBahrainBangladeshBarbadosBelarusBelgiumBelizeBeninBhutanBoliviaBosnia and HerzegovinaBotswanaBrazilBrunei DarussalamBulgariaBurkina FasoBurundiCabo VerdeCambodiaCameroonCanadaCaribbean small statesCentral African RepublicCentral Europe and the BalticsChadChannel IslandsChileChinaColombiaComorosCongo, Dem. Rep.Congo, Rep.Costa RicaCote d'IvoireCroatiaCubaCuracaoCyprusCzech RepublicDenmarkDjiboutiDominicaDominican RepublicEarly-demographic dividendEast Asia & PacificEast Asia & Pacific (excluding high income)East Asia & Pacific (IDA & IBRD countries)EcuadorEgypt, Arab Rep.El SalvadorEquatorial GuineaEritreaEstoniaEthiopiaEuro areaEurope & Central AsiaEurope & Central Asia (excluding high income)Europe & Central Asia (IDA & IBRD countries)European UnionFijiFinlandFragile and conflict affected situationsFranceFrench PolynesiaGabonGambia, TheGeorgiaGermanyGhanaGreeceGreenlandGrenadaGuamGuatemalaGuineaGuinea-BissauGuyanaHaitiHeavily indebted poor countries (HIPC)High incomeHondurasHong Kong SAR, ChinaHungaryIBRD onlyIcelandIDA & IBRD totalIDA blendIDA onlyIDA totalIndiaIndonesiaIran, Islamic Rep.IraqIrelandIsraelItalyJamaicaJapanJordanKazakhstanKenyaKiribatiKorea, Dem. People’s Rep.Korea, Rep.KuwaitKyrgyz RepublicLao PDRLate-demographic dividendLatin America & Caribbean Latin America & Caribbean (excluding high income)Latin America & the Caribbean (IDA & IBRD countries)LatviaLeast developed countries: UN classificationLebanonLesothoLiberiaLibyaLithuaniaLow & middle incomeLow incomeLower middle incomeLuxembourgMacao SAR, ChinaMacedonia, FYRMadagascarMalawiMalaysiaMaldivesMaliMaltaMarshall IslandsMauritaniaMauritiusMexicoMicronesia, Fed. Sts.Middle East & North AfricaMiddle East & North Africa (excluding high income)Middle East & North Africa (IDA & IBRD countries)Middle incomeMoldovaMongoliaMontenegroMoroccoMozambiqueMyanmarNamibiaNepalNetherlandsNew CaledoniaNew ZealandNicaraguaNigerNigeriaNorth AmericaNorwayOECD membersOmanOther small statesPacific island small statesPakistanPanamaPapua New GuineaParaguayPeruPhilippinesPolandPortugalPost-demographic dividendPre-demographic dividendPuerto RicoQatarRomaniaRussian FederationRwandaSamoaSao Tome and PrincipeSaudi ArabiaSenegalSerbiaSeychellesSierra LeoneSingaporeSlovak RepublicSloveniaSmall statesSolomon IslandsSomaliaSouth AfricaSouth AsiaSouth Asia (IDA & IBRD)South SudanSpainSri LankaSt. Kitts and NevisSt. LuciaSt. Vincent and the GrenadinesSub-Saharan Africa Sub-Saharan Africa (excluding high income)Sub-Saharan Africa (IDA & IBRD countries)SudanSurinameSwazilandSwedenSwitzerlandSyrian Arab RepublicTajikistanTanzaniaThailandTimor-LesteTogoTongaTrinidad and TobagoTunisiaTurkeyTurkmenistanUgandaUkraineUnited Arab EmiratesUnited KingdomUnited StatesUpper middle incomeUruguayUzbekistanVanuatuVenezuela, RBVietnamVirgin Islands (U.S.)West Bank and GazaWorldYemen, Rep.ZambiaZimbabwe Timeline:
This timeline shows a graph from 1961 to 2013 of OECD members. No data until 1960. Number of actual observations by date: 53.
Source name:
World Development Indicators
Source organization:
(1) United Nations Population Division. World Population Prospects. New York, United Nations, Department of Economic and Social Affairs (advanced Excel tables). Available at http://esa.un.org/wpp/unpp/panel_population.htm, (2) University of California, Berkeley, and Max Planck Institute for Demographic Research. Human Mortality Database. [ www.mortality.org or www.humanmortality.de].
Categories, topics:
Health, Gender
Last updated:
apr 23, 2017
Indicators value changes by year
Minimum:
113.454
jan 1, 2012
Maximum:
225.404
jan 1, 1961
At the date of observation
Value
Absolute change
Change from previous value
jan 1, 1961
225.404
+225.404
0.0%
jan 1, 1962
221.768
-3.637
-1.61%
jan 1, 1963
222.904
+1.137
0.51%
jan 1, 1964
222.337
-0.567
-0.25%
jan 1, 1965
218.465
-3.873
-1.74%
jan 1, 1966
218.153
-0.312
-0.14%
jan 1, 1967
216.958
-1.195
-0.55%
jan 1, 1968
215.348
-1.61
-0.74%
jan 1, 1969
216.553
+1.205
0.56%
jan 1, 1970
217.71
+1.157
0.53%
jan 1, 1971
214.264
-3.446
-1.58%
jan 1, 1972
212.369
-1.895
-0.88%
jan 1, 1973
210.687
-1.682
-0.79%
jan 1, 1974
208.949
-1.738
-0.82%
jan 1, 1975
204.987
-3.963
-1.9%
jan 1, 1976
202.746
-2.241
-1.09%
jan 1, 1977
200.77
-1.975
-0.97%
jan 1, 1978
197.931
-2.839
-1.41%
jan 1, 1979
196.137
-1.794
-0.91%
jan 1, 1980
193.741
-2.396
-1.22%
jan 1, 1981
192.303
-1.437
-0.74%
jan 1, 1982
188.527
-3.777
-1.96%
jan 1, 1983
184.269
-4.258
-2.26%
jan 1, 1984
183.01
-1.258
-0.68%
jan 1, 1985
180.27
-2.741
-1.5%
jan 1, 1986
178.413
-1.856
-1.03%
jan 1, 1987
175.815
-2.598
-1.46%
jan 1, 1988
172.628
-3.187
-1.81%
jan 1, 1989
170.567
-2.061
-1.19%
jan 1, 1990
168.908
-1.659
-0.97%
jan 1, 1991
166.243
-2.665
-1.58%
jan 1, 1992
164.871
-1.372
-0.83%
jan 1, 1993
162.031
-2.84
-1.72%
jan 1, 1994
160.003
-2.029
-1.25%
jan 1, 1995
157.329
-2.674
-1.67%
jan 1, 1996
155.436
-1.893
-1.2%
jan 1, 1997
149.853
-5.583
-3.59%
jan 1, 1998
144.847
-5.006
-3.34%
jan 1, 1999
142.176
-2.671
-1.84%
jan 1, 2000
140.512
-1.664
-1.17%
jan 1, 2001
137.37
-3.143
-2.24%
jan 1, 2002
135.337
-2.033
-1.48%
jan 1, 2003
133.409
-1.927
-1.42%
jan 1, 2004
131.853
-1.556
-1.17%
jan 1, 2005
128.259
-3.594
-2.73%
jan 1, 2006
127.282
-0.977
-0.76%
jan 1, 2007
125.421
-1.861
-1.46%
jan 1, 2008
123.032
-2.389
-1.9%
jan 1, 2009
121.041
-1.99
-1.62%
jan 1, 2010
118.917
-2.124
-1.75%
jan 1, 2011
114.919
-3.998
-3.36%
jan 1, 2012
113.454
-1.465
-1.27%
jan 1, 2013
114.994
+1.539
1.36%
Ranking of countries by current statistics by years


Comments: