29
/
en
AIzaSyAYiBZKx7MnpbEhh9jyipgxe19OcubqV5w
April 1, 2024
164038
Japan
JPN
true
2
1
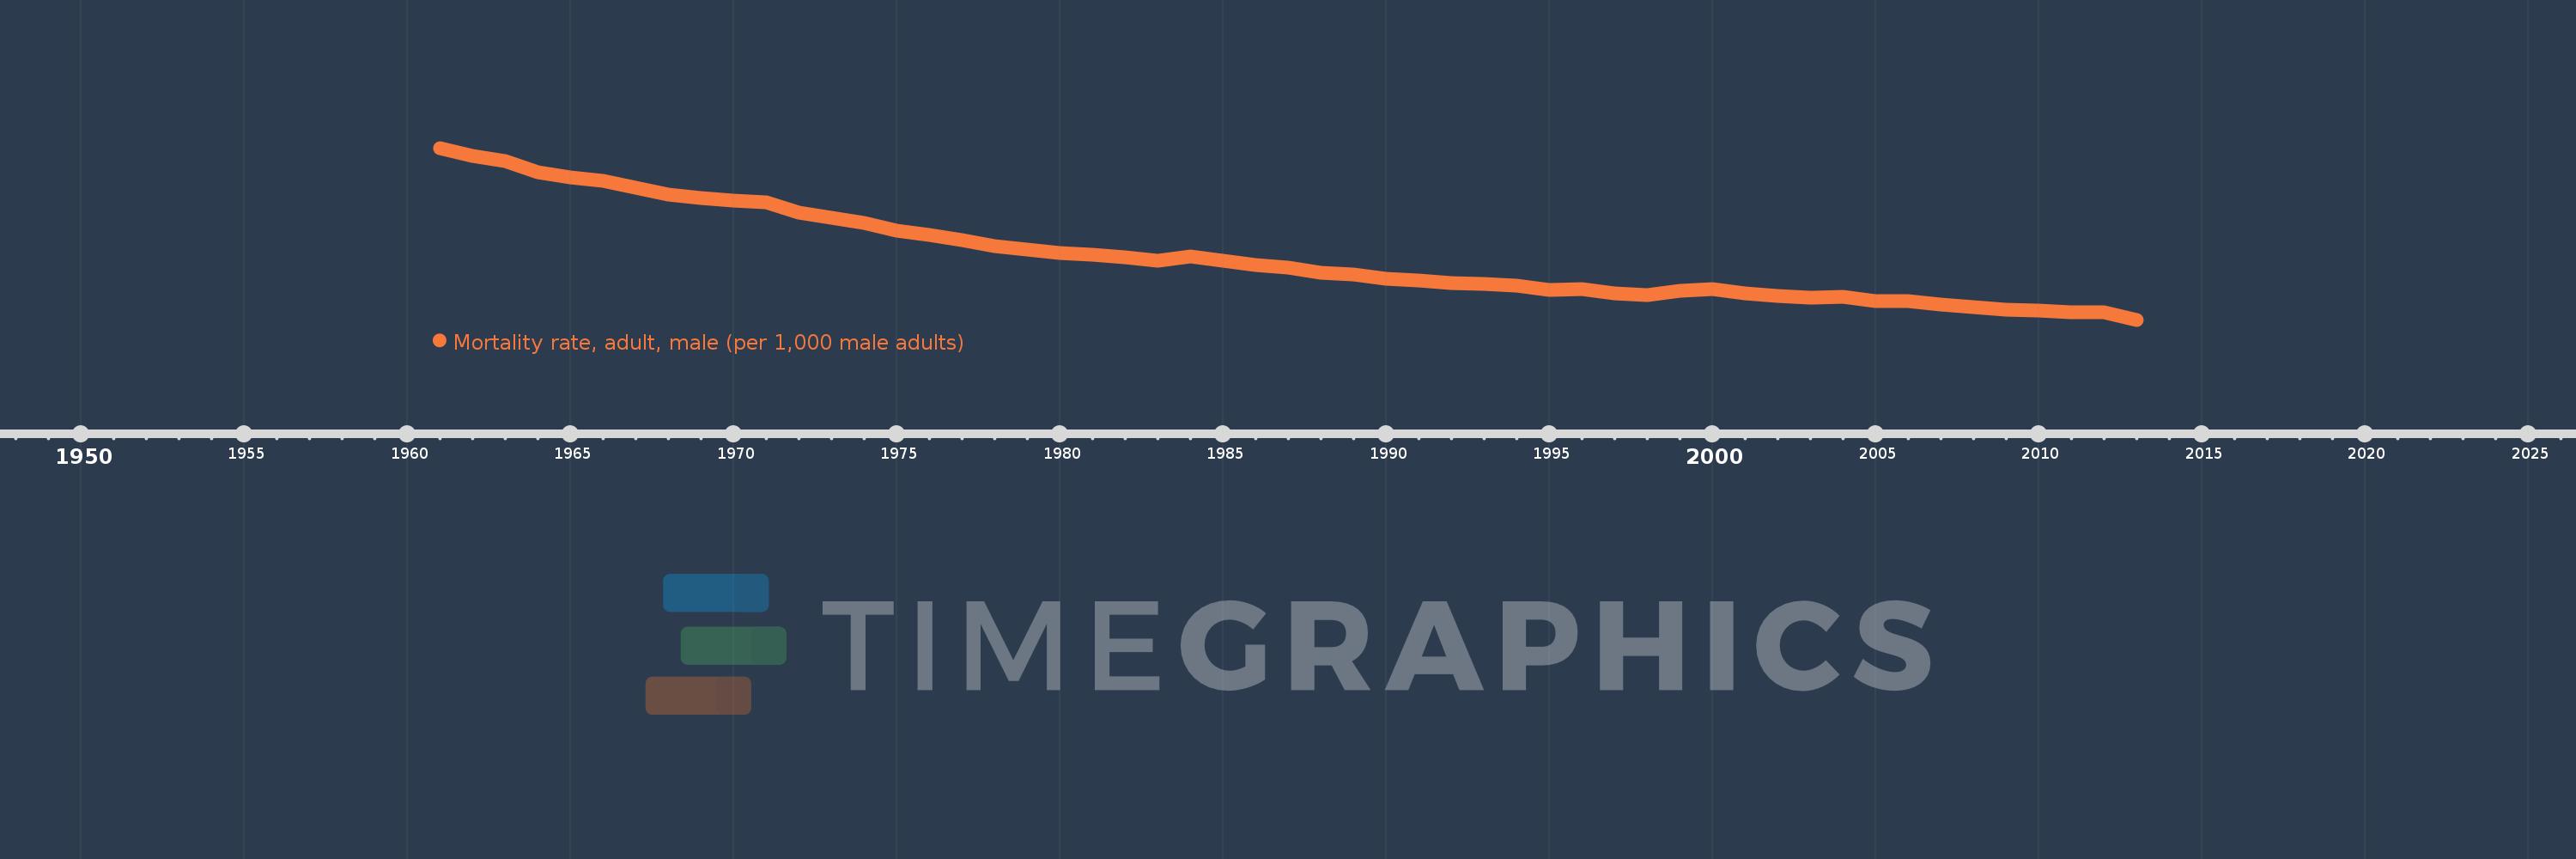
Mortality rate, adult, male (per 1,000 male adults)
2013,2012,2011,2010,2009,2008,2007,2006,2005,2004,2003,2002,2001,2000,1999,1998,1997,1996,1995,1994,1993,1992,1991,1990,1989,1988,1987,1986,1985,1984,1983,1982,1981,1980,1979,1978,1977,1976,1975,1974,1973,1972,1971,1970,1969,1968,1967,1966,1965,1964,1963,1962,1961
This statistics in other country:
AfghanistanAlbaniaAlgeriaAngolaAntigua and BarbudaArab WorldArgentinaArmeniaArubaAustraliaAustriaAzerbaijanBahamas, TheBahrainBangladeshBarbadosBelarusBelgiumBelizeBeninBhutanBoliviaBosnia and HerzegovinaBotswanaBrazilBrunei DarussalamBulgariaBurkina FasoBurundiCabo VerdeCambodiaCameroonCanadaCaribbean small statesCentral African RepublicCentral Europe and the BalticsChadChannel IslandsChileChinaColombiaComorosCongo, Dem. Rep.Congo, Rep.Costa RicaCote d'IvoireCroatiaCubaCuracaoCyprusCzech RepublicDenmarkDjiboutiDominicaDominican RepublicEarly-demographic dividendEast Asia & PacificEast Asia & Pacific (excluding high income)East Asia & Pacific (IDA & IBRD countries)EcuadorEgypt, Arab Rep.El SalvadorEquatorial GuineaEritreaEstoniaEthiopiaEuro areaEurope & Central AsiaEurope & Central Asia (excluding high income)Europe & Central Asia (IDA & IBRD countries)European UnionFijiFinlandFragile and conflict affected situationsFranceFrench PolynesiaGabonGambia, TheGeorgiaGermanyGhanaGreeceGreenlandGrenadaGuamGuatemalaGuineaGuinea-BissauGuyanaHaitiHeavily indebted poor countries (HIPC)High incomeHondurasHong Kong SAR, ChinaHungaryIBRD onlyIcelandIDA & IBRD totalIDA blendIDA onlyIDA totalIndiaIndonesiaIran, Islamic Rep.IraqIrelandIsraelItalyJamaicaJapanJordanKazakhstanKenyaKiribatiKorea, Dem. People’s Rep.Korea, Rep.KuwaitKyrgyz RepublicLao PDRLate-demographic dividendLatin America & Caribbean Latin America & Caribbean (excluding high income)Latin America & the Caribbean (IDA & IBRD countries)LatviaLeast developed countries: UN classificationLebanonLesothoLiberiaLibyaLithuaniaLow & middle incomeLow incomeLower middle incomeLuxembourgMacao SAR, ChinaMacedonia, FYRMadagascarMalawiMalaysiaMaldivesMaliMaltaMarshall IslandsMauritaniaMauritiusMexicoMicronesia, Fed. Sts.Middle East & North AfricaMiddle East & North Africa (excluding high income)Middle East & North Africa (IDA & IBRD countries)Middle incomeMoldovaMongoliaMontenegroMoroccoMozambiqueMyanmarNamibiaNepalNetherlandsNew CaledoniaNew ZealandNicaraguaNigerNigeriaNorth AmericaNorwayOECD membersOmanOther small statesPacific island small statesPakistanPanamaPapua New GuineaParaguayPeruPhilippinesPolandPortugalPost-demographic dividendPre-demographic dividendPuerto RicoQatarRomaniaRussian FederationRwandaSamoaSao Tome and PrincipeSaudi ArabiaSenegalSerbiaSeychellesSierra LeoneSingaporeSlovak RepublicSloveniaSmall statesSolomon IslandsSomaliaSouth AfricaSouth AsiaSouth Asia (IDA & IBRD)South SudanSpainSri LankaSt. Kitts and NevisSt. LuciaSt. Vincent and the GrenadinesSub-Saharan Africa Sub-Saharan Africa (excluding high income)Sub-Saharan Africa (IDA & IBRD countries)SudanSurinameSwazilandSwedenSwitzerlandSyrian Arab RepublicTajikistanTanzaniaThailandTimor-LesteTogoTongaTrinidad and TobagoTunisiaTurkeyTurkmenistanUgandaUkraineUnited Arab EmiratesUnited KingdomUnited StatesUpper middle incomeUruguayUzbekistanVanuatuVenezuela, RBVietnamVirgin Islands (U.S.)West Bank and GazaWorldYemen, Rep.ZambiaZimbabwe Timeline:
This timeline shows a graph from 1961 to 2013 of Japan. No data until 1960. Number of actual observations by date: 53.
Source name:
World Development Indicators
Source organization:
(1) United Nations Population Division. World Population Prospects. New York, United Nations, Department of Economic and Social Affairs (advanced Excel tables). Available at http://esa.un.org/wpp/unpp/panel_population.htm, (2) University of California, Berkeley, and Max Planck Institute for Demographic Research. Human Mortality Database. [ www.mortality.org or www.humanmortality.de].
Categories, topics:
Health, Gender
Last updated:
apr 23, 2017
Indicators value changes by year
Minimum:
76.911
jan 1, 2013
Maximum:
217.422
jan 1, 1961
At the date of observation
Value
Absolute change
Change from previous value
jan 1, 1961
217.422
+217.422
0.0%
jan 1, 1962
210.962
-6.46
-2.97%
jan 1, 1963
206.635
-4.327
-2.05%
jan 1, 1964
197.858
-8.777
-4.25%
jan 1, 1965
193.413
-4.445
-2.25%
jan 1, 1966
190.255
-3.158
-1.63%
jan 1, 1967
185.023
-5.232
-2.75%
jan 1, 1968
178.988
-6.035
-3.26%
jan 1, 1969
176.238
-2.75
-1.54%
jan 1, 1970
174.624
-1.614
-0.92%
jan 1, 1971
172.989
-1.635
-0.94%
jan 1, 1972
164.19
-8.799
-5.09%
jan 1, 1973
160.159
-4.031
-2.46%
jan 1, 1974
155.86
-4.299
-2.68%
jan 1, 1975
150.073
-5.787
-3.71%
jan 1, 1976
146.029
-4.044
-2.69%
jan 1, 1977
141.786
-4.243
-2.91%
jan 1, 1978
137.387
-4.399
-3.1%
jan 1, 1979
134.557
-2.83
-2.06%
jan 1, 1980
131.675
-2.882
-2.14%
jan 1, 1981
130.32
-1.355
-1.03%
jan 1, 1982
127.744
-2.576
-1.98%
jan 1, 1983
125.43
-2.314
-1.81%
jan 1, 1984
128.577
+3.147
2.51%
jan 1, 1985
125.42
-3.157
-2.46%
jan 1, 1986
121.969
-3.451
-2.75%
jan 1, 1987
119.485
-2.484
-2.04%
jan 1, 1988
115.358
-4.127
-3.45%
jan 1, 1989
114.165
-1.193
-1.03%
jan 1, 1990
110.443
-3.722
-3.26%
jan 1, 1991
108.786
-1.657
-1.5%
jan 1, 1992
107.084
-1.702
-1.56%
jan 1, 1993
106.404
-0.68
-0.64%
jan 1, 1994
104.62
-1.784
-1.68%
jan 1, 1995
101.047
-3.573
-3.42%
jan 1, 1996
102.291
+1.244
1.23%
jan 1, 1997
98.422
-3.869
-3.78%
jan 1, 1998
97.409
-1.013
-1.03%
jan 1, 1999
100.436
+3.027
3.11%
jan 1, 2000
101.653
+1.217
1.21%
jan 1, 2001
98.2
-3.453
-3.4%
jan 1, 2002
96.534
-1.666
-1.7%
jan 1, 2003
94.862
-1.672
-1.73%
jan 1, 2004
95.879
+1.017
1.07%
jan 1, 2005
92.395
-3.484
-3.63%
jan 1, 2006
92.446
+0.051
0.06%
jan 1, 2007
89.37
-3.076
-3.33%
jan 1, 2008
87.057
-2.313
-2.59%
jan 1, 2009
85.14
-1.917
-2.2%
jan 1, 2010
84.198
-0.942
-1.11%
jan 1, 2011
82.682
-1.516
-1.8%
jan 1, 2012
83.08
+0.398
0.48%
jan 1, 2013
76.911
-6.169
-7.43%
Ranking of countries by current statistics by years


Comments: