29
/
en
AIzaSyAYiBZKx7MnpbEhh9jyipgxe19OcubqV5w
April 1, 2024
25930
Central Europe and the Baltics
CEB
false
2
1
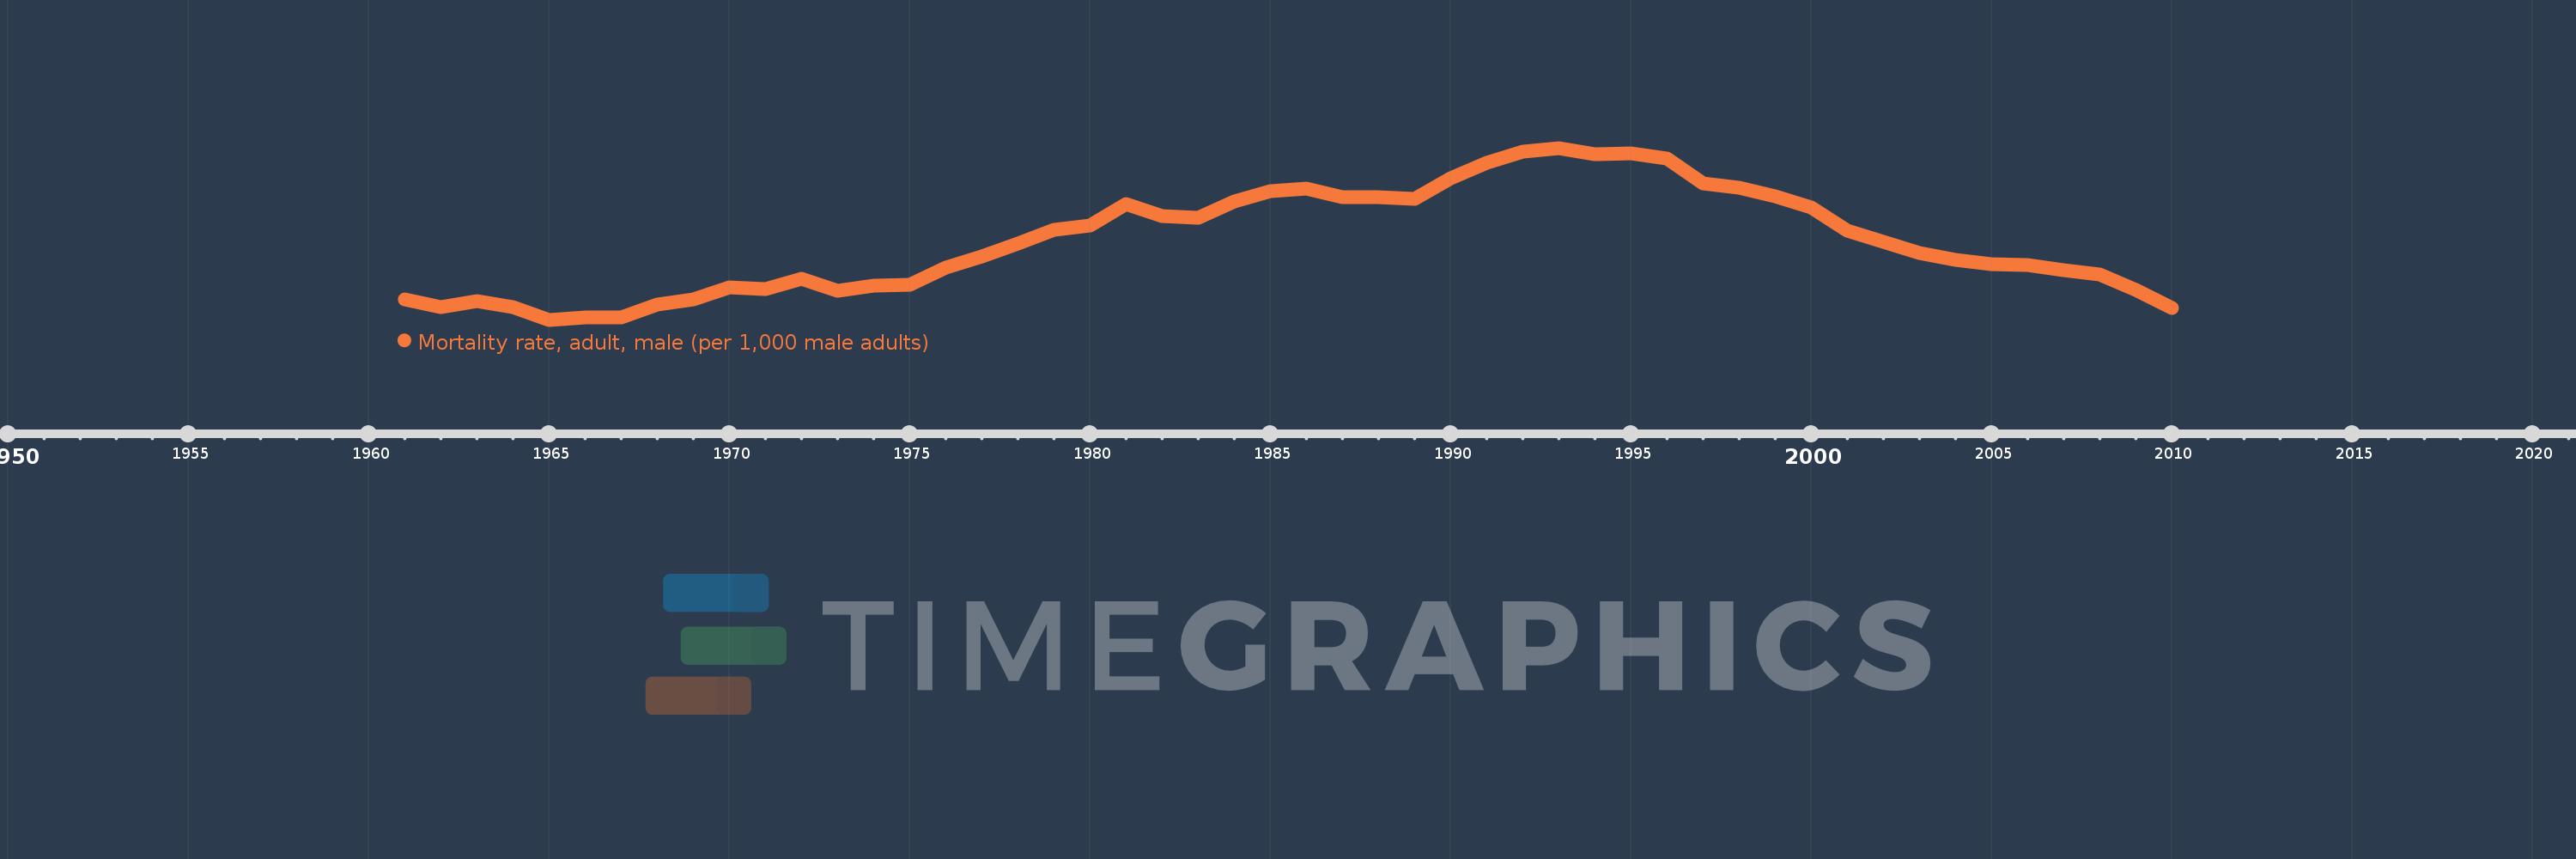
Mortality rate, adult, male (per 1,000 male adults)
2010,2009,2008,2007,2006,2005,2004,2003,2002,2001,2000,1999,1998,1997,1996,1995,1994,1993,1992,1991,1990,1989,1988,1987,1986,1985,1984,1983,1982,1981,1980,1979,1978,1977,1976,1975,1974,1973,1972,1971,1970,1969,1968,1967,1966,1965,1964,1963,1962,1961
This statistics in other country:
AfghanistanAlbaniaAlgeriaAngolaAntigua and BarbudaArab WorldArgentinaArmeniaArubaAustraliaAustriaAzerbaijanBahamas, TheBahrainBangladeshBarbadosBelarusBelgiumBelizeBeninBhutanBoliviaBosnia and HerzegovinaBotswanaBrazilBrunei DarussalamBulgariaBurkina FasoBurundiCabo VerdeCambodiaCameroonCanadaCaribbean small statesCentral African RepublicCentral Europe and the BalticsChadChannel IslandsChileChinaColombiaComorosCongo, Dem. Rep.Congo, Rep.Costa RicaCote d'IvoireCroatiaCubaCuracaoCyprusCzech RepublicDenmarkDjiboutiDominicaDominican RepublicEarly-demographic dividendEast Asia & PacificEast Asia & Pacific (excluding high income)East Asia & Pacific (IDA & IBRD countries)EcuadorEgypt, Arab Rep.El SalvadorEquatorial GuineaEritreaEstoniaEthiopiaEuro areaEurope & Central AsiaEurope & Central Asia (excluding high income)Europe & Central Asia (IDA & IBRD countries)European UnionFijiFinlandFragile and conflict affected situationsFranceFrench PolynesiaGabonGambia, TheGeorgiaGermanyGhanaGreeceGreenlandGrenadaGuamGuatemalaGuineaGuinea-BissauGuyanaHaitiHeavily indebted poor countries (HIPC)High incomeHondurasHong Kong SAR, ChinaHungaryIBRD onlyIcelandIDA & IBRD totalIDA blendIDA onlyIDA totalIndiaIndonesiaIran, Islamic Rep.IraqIrelandIsraelItalyJamaicaJapanJordanKazakhstanKenyaKiribatiKorea, Dem. People’s Rep.Korea, Rep.KuwaitKyrgyz RepublicLao PDRLate-demographic dividendLatin America & Caribbean Latin America & Caribbean (excluding high income)Latin America & the Caribbean (IDA & IBRD countries)LatviaLeast developed countries: UN classificationLebanonLesothoLiberiaLibyaLithuaniaLow & middle incomeLow incomeLower middle incomeLuxembourgMacao SAR, ChinaMacedonia, FYRMadagascarMalawiMalaysiaMaldivesMaliMaltaMarshall IslandsMauritaniaMauritiusMexicoMicronesia, Fed. Sts.Middle East & North AfricaMiddle East & North Africa (excluding high income)Middle East & North Africa (IDA & IBRD countries)Middle incomeMoldovaMongoliaMontenegroMoroccoMozambiqueMyanmarNamibiaNepalNetherlandsNew CaledoniaNew ZealandNicaraguaNigerNigeriaNorth AmericaNorwayOECD membersOmanOther small statesPacific island small statesPakistanPanamaPapua New GuineaParaguayPeruPhilippinesPolandPortugalPost-demographic dividendPre-demographic dividendPuerto RicoQatarRomaniaRussian FederationRwandaSamoaSao Tome and PrincipeSaudi ArabiaSenegalSerbiaSeychellesSierra LeoneSingaporeSlovak RepublicSloveniaSmall statesSolomon IslandsSomaliaSouth AfricaSouth AsiaSouth Asia (IDA & IBRD)South SudanSpainSri LankaSt. Kitts and NevisSt. LuciaSt. Vincent and the GrenadinesSub-Saharan Africa Sub-Saharan Africa (excluding high income)Sub-Saharan Africa (IDA & IBRD countries)SudanSurinameSwazilandSwedenSwitzerlandSyrian Arab RepublicTajikistanTanzaniaThailandTimor-LesteTogoTongaTrinidad and TobagoTunisiaTurkeyTurkmenistanUgandaUkraineUnited Arab EmiratesUnited KingdomUnited StatesUpper middle incomeUruguayUzbekistanVanuatuVenezuela, RBVietnamVirgin Islands (U.S.)West Bank and GazaWorldYemen, Rep.ZambiaZimbabwe Timeline:
This timeline shows a graph from 1961 to 2010 of Central Europe and the Baltics. No data until 1960. Number of actual observations by date: 50.
Source name:
World Development Indicators
Source organization:
(1) United Nations Population Division. World Population Prospects. New York, United Nations, Department of Economic and Social Affairs (advanced Excel tables). Available at http://esa.un.org/wpp/unpp/panel_population.htm, (2) University of California, Berkeley, and Max Planck Institute for Demographic Research. Human Mortality Database. [ www.mortality.org or www.humanmortality.de].
Categories, topics:
Health, Gender
Last updated:
apr 23, 2017
Indicators value changes by year
Minimum:
192.848
jan 1, 1965
Maximum:
263.012
jan 1, 1993
At the date of observation
Value
Absolute change
Change from previous value
jan 1, 1961
201.049
+201.049
0.0%
jan 1, 1962
198.097
-2.952
-1.47%
jan 1, 1963
200.307
+2.21
1.12%
jan 1, 1964
197.882
-2.425
-1.21%
jan 1, 1965
192.848
-5.034
-2.54%
jan 1, 1966
193.749
+0.901
0.47%
jan 1, 1967
193.64
-0.109
-0.06%
jan 1, 1968
199.02
+5.38
2.78%
jan 1, 1969
201.077
+2.057
1.03%
jan 1, 1970
206.057
+4.98
2.48%
jan 1, 1971
205.222
-0.835
-0.41%
jan 1, 1972
209.584
+4.362
2.13%
jan 1, 1973
204.716
-4.868
-2.32%
jan 1, 1974
206.892
+2.176
1.06%
jan 1, 1975
207.242
+0.35
0.17%
jan 1, 1976
214.075
+6.834
3.3%
jan 1, 1977
218.554
+4.479
2.09%
jan 1, 1978
224.002
+5.447
2.49%
jan 1, 1979
229.436
+5.434
2.43%
jan 1, 1980
231.431
+1.996
0.87%
jan 1, 1981
240.266
+8.834
3.82%
jan 1, 1982
235.217
-5.049
-2.1%
jan 1, 1983
234.625
-0.591
-0.25%
jan 1, 1984
241.08
+6.455
2.75%
jan 1, 1985
245.348
+4.268
1.77%
jan 1, 1986
246.512
+1.165
0.47%
jan 1, 1987
243.081
-3.431
-1.39%
jan 1, 1988
242.832
-0.249
-0.1%
jan 1, 1989
242.205
-0.627
-0.26%
jan 1, 1990
250.703
+8.497
3.51%
jan 1, 1991
256.966
+6.263
2.5%
jan 1, 1992
261.596
+4.63
1.8%
jan 1, 1993
263.012
+1.416
0.54%
jan 1, 1994
260.39
-2.621
-1.0%
jan 1, 1995
260.877
+0.487
0.19%
jan 1, 1996
258.86
-2.017
-0.77%
jan 1, 1997
248.458
-10.403
-4.02%
jan 1, 1998
246.678
-1.779
-0.72%
jan 1, 1999
243.398
-3.28
-1.33%
jan 1, 2000
238.57
-4.829
-1.98%
jan 1, 2001
229.066
-9.504
-3.98%
jan 1, 2002
224.609
-4.456
-1.95%
jan 1, 2003
220.197
-4.412
-1.96%
jan 1, 2004
217.415
-2.782
-1.26%
jan 1, 2005
215.404
-2.011
-0.93%
jan 1, 2006
215.18
-0.224
-0.1%
jan 1, 2007
213.257
-1.923
-0.89%
jan 1, 2008
211.253
-2.005
-0.94%
jan 1, 2009
204.973
-6.279
-2.97%
jan 1, 2010
197.5
-7.474
-3.65%
Ranking of countries by current statistics by years


Comments: