29
/
en
AIzaSyAYiBZKx7MnpbEhh9jyipgxe19OcubqV5w
April 1, 2024
227670
Qatar
QAT
true
2
1
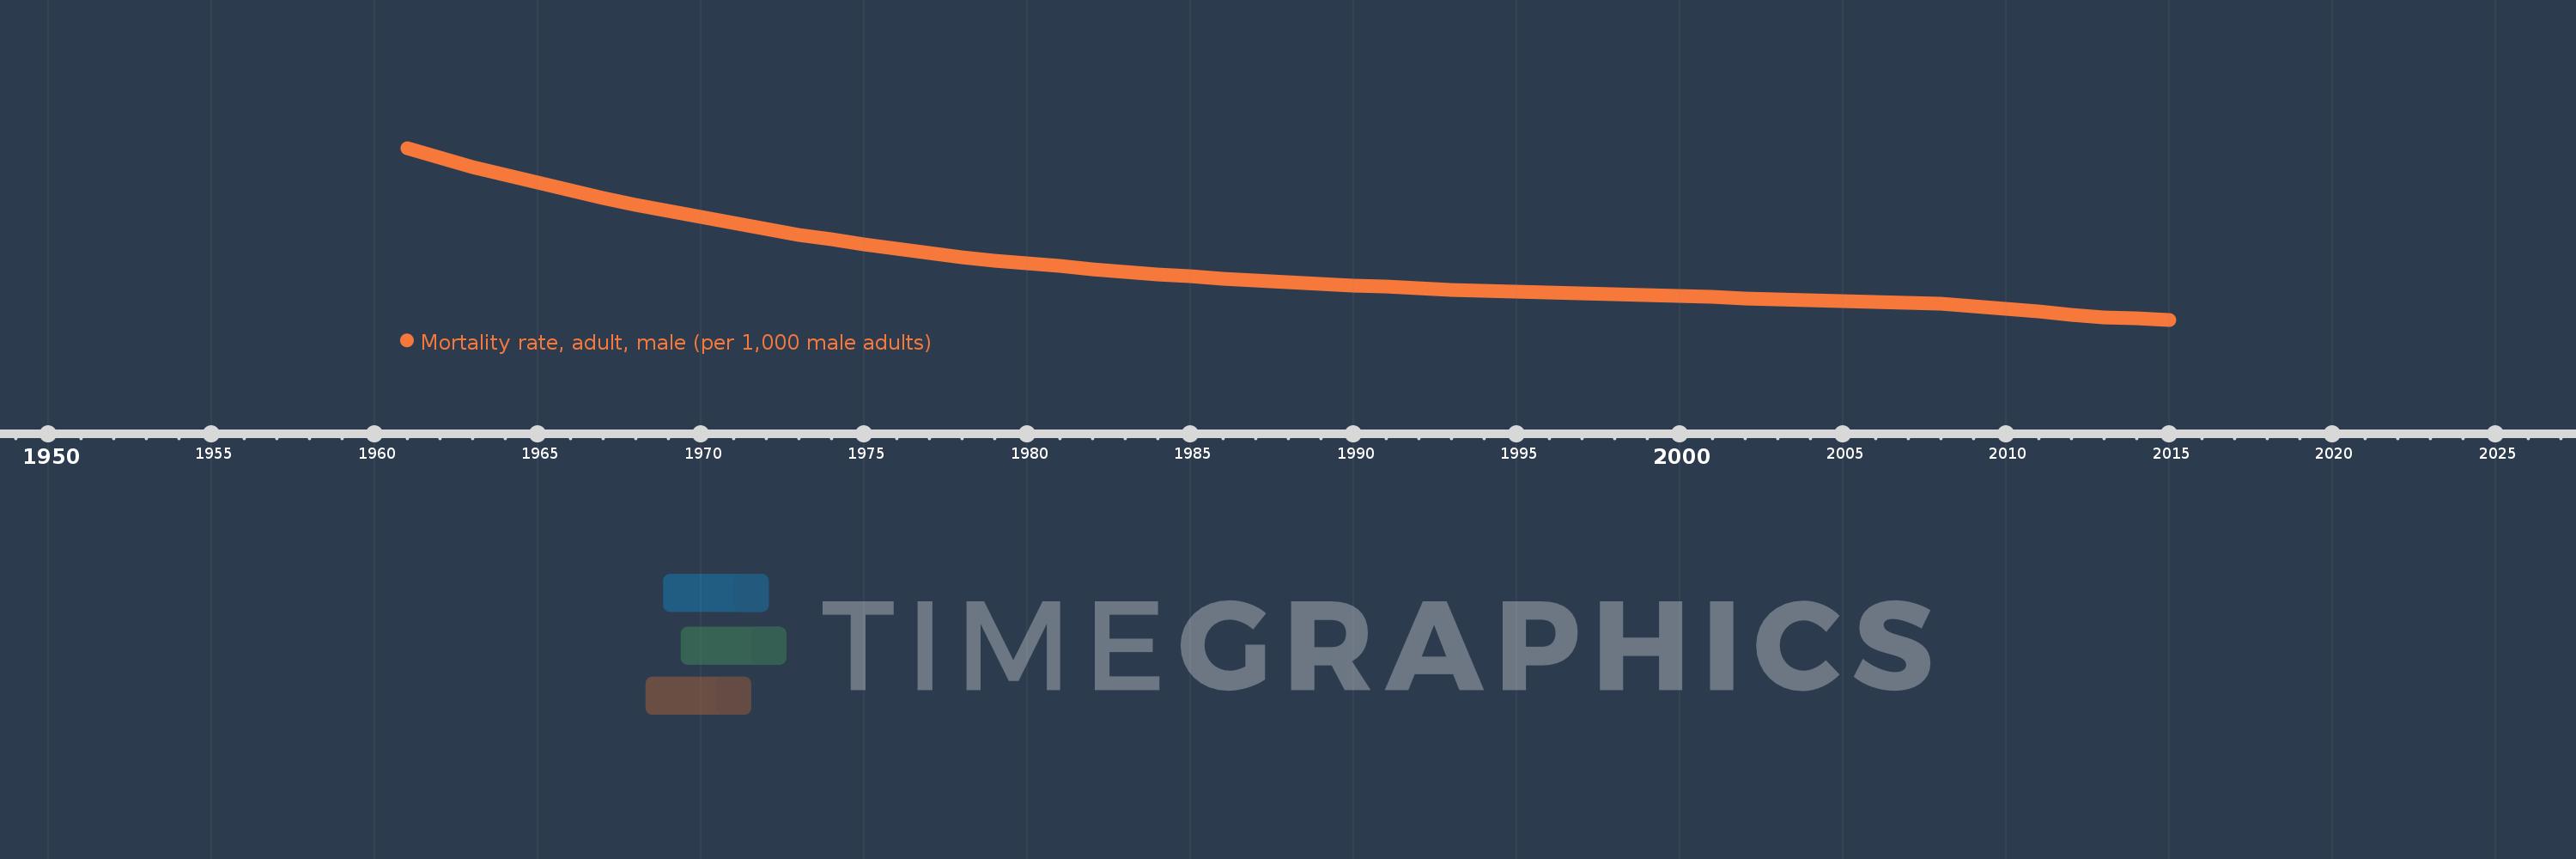
Mortality rate, adult, male (per 1,000 male adults)
2015,2014,2013,2012,2011,2010,2009,2008,2007,2006,2005,2004,2003,2002,2001,2000,1999,1998,1997,1996,1995,1994,1993,1992,1991,1990,1989,1988,1987,1986,1985,1984,1983,1982,1981,1980,1979,1978,1977,1976,1975,1974,1973,1972,1971,1970,1969,1968,1967,1966,1965,1964,1963,1962,1961
This statistics in other country:
AfghanistanAlbaniaAlgeriaAngolaAntigua and BarbudaArab WorldArgentinaArmeniaArubaAustraliaAustriaAzerbaijanBahamas, TheBahrainBangladeshBarbadosBelarusBelgiumBelizeBeninBhutanBoliviaBosnia and HerzegovinaBotswanaBrazilBrunei DarussalamBulgariaBurkina FasoBurundiCabo VerdeCambodiaCameroonCanadaCaribbean small statesCentral African RepublicCentral Europe and the BalticsChadChannel IslandsChileChinaColombiaComorosCongo, Dem. Rep.Congo, Rep.Costa RicaCote d'IvoireCroatiaCubaCuracaoCyprusCzech RepublicDenmarkDjiboutiDominicaDominican RepublicEarly-demographic dividendEast Asia & PacificEast Asia & Pacific (excluding high income)East Asia & Pacific (IDA & IBRD countries)EcuadorEgypt, Arab Rep.El SalvadorEquatorial GuineaEritreaEstoniaEthiopiaEuro areaEurope & Central AsiaEurope & Central Asia (excluding high income)Europe & Central Asia (IDA & IBRD countries)European UnionFijiFinlandFragile and conflict affected situationsFranceFrench PolynesiaGabonGambia, TheGeorgiaGermanyGhanaGreeceGreenlandGrenadaGuamGuatemalaGuineaGuinea-BissauGuyanaHaitiHeavily indebted poor countries (HIPC)High incomeHondurasHong Kong SAR, ChinaHungaryIBRD onlyIcelandIDA & IBRD totalIDA blendIDA onlyIDA totalIndiaIndonesiaIran, Islamic Rep.IraqIrelandIsraelItalyJamaicaJapanJordanKazakhstanKenyaKiribatiKorea, Dem. People’s Rep.Korea, Rep.KuwaitKyrgyz RepublicLao PDRLate-demographic dividendLatin America & Caribbean Latin America & Caribbean (excluding high income)Latin America & the Caribbean (IDA & IBRD countries)LatviaLeast developed countries: UN classificationLebanonLesothoLiberiaLibyaLithuaniaLow & middle incomeLow incomeLower middle incomeLuxembourgMacao SAR, ChinaMacedonia, FYRMadagascarMalawiMalaysiaMaldivesMaliMaltaMarshall IslandsMauritaniaMauritiusMexicoMicronesia, Fed. Sts.Middle East & North AfricaMiddle East & North Africa (excluding high income)Middle East & North Africa (IDA & IBRD countries)Middle incomeMoldovaMongoliaMontenegroMoroccoMozambiqueMyanmarNamibiaNepalNetherlandsNew CaledoniaNew ZealandNicaraguaNigerNigeriaNorth AmericaNorwayOECD membersOmanOther small statesPacific island small statesPakistanPanamaPapua New GuineaParaguayPeruPhilippinesPolandPortugalPost-demographic dividendPre-demographic dividendPuerto RicoQatarRomaniaRussian FederationRwandaSamoaSao Tome and PrincipeSaudi ArabiaSenegalSerbiaSeychellesSierra LeoneSingaporeSlovak RepublicSloveniaSmall statesSolomon IslandsSomaliaSouth AfricaSouth AsiaSouth Asia (IDA & IBRD)South SudanSpainSri LankaSt. Kitts and NevisSt. LuciaSt. Vincent and the GrenadinesSub-Saharan Africa Sub-Saharan Africa (excluding high income)Sub-Saharan Africa (IDA & IBRD countries)SudanSurinameSwazilandSwedenSwitzerlandSyrian Arab RepublicTajikistanTanzaniaThailandTimor-LesteTogoTongaTrinidad and TobagoTunisiaTurkeyTurkmenistanUgandaUkraineUnited Arab EmiratesUnited KingdomUnited StatesUpper middle incomeUruguayUzbekistanVanuatuVenezuela, RBVietnamVirgin Islands (U.S.)West Bank and GazaWorldYemen, Rep.ZambiaZimbabwe Timeline:
This timeline shows a graph from 1961 to 2015 of Qatar. No data until 1960. Number of actual observations by date: 55.
Source name:
World Development Indicators
Source organization:
(1) United Nations Population Division. World Population Prospects. New York, United Nations, Department of Economic and Social Affairs (advanced Excel tables). Available at http://esa.un.org/wpp/unpp/panel_population.htm, (2) University of California, Berkeley, and Max Planck Institute for Demographic Research. Human Mortality Database. [ www.mortality.org or www.humanmortality.de].
Categories, topics:
Health, Gender
Last updated:
apr 23, 2017
Indicators value changes by year
Minimum:
75.503
jan 1, 2015
Maximum:
229.705
jan 1, 1961
At the date of observation
Value
Absolute change
Change from previous value
jan 1, 1961
229.705
+229.705
0.0%
jan 1, 1962
221.083
-8.622
-3.75%
jan 1, 1963
212.46
-8.623
-3.9%
jan 1, 1964
205.62
-6.84
-3.22%
jan 1, 1965
198.781
-6.839
-3.33%
jan 1, 1966
191.941
-6.84
-3.44%
jan 1, 1967
185.101
-6.84
-3.56%
jan 1, 1968
178.262
-6.839
-3.69%
jan 1, 1969
172.907
-5.355
-3.0%
jan 1, 1970
167.552
-5.355
-3.1%
jan 1, 1971
162.197
-5.355
-3.2%
jan 1, 1972
156.842
-5.355
-3.3%
jan 1, 1973
151.487
-5.355
-3.41%
jan 1, 1974
147.485
-4.002
-2.64%
jan 1, 1975
143.483
-4.002
-2.71%
jan 1, 1976
139.481
-4.002
-2.79%
jan 1, 1977
135.479
-4.002
-2.87%
jan 1, 1978
131.477
-4.002
-2.95%
jan 1, 1979
128.852
-2.625
-2.0%
jan 1, 1980
126.227
-2.625
-2.04%
jan 1, 1981
123.602
-2.625
-2.08%
jan 1, 1982
120.976
-2.626
-2.12%
jan 1, 1983
118.351
-2.625
-2.17%
jan 1, 1984
116.455
-1.896
-1.6%
jan 1, 1985
114.559
-1.896
-1.63%
jan 1, 1986
112.662
-1.897
-1.66%
jan 1, 1987
110.766
-1.896
-1.68%
jan 1, 1988
108.87
-1.896
-1.71%
jan 1, 1989
107.599
-1.271
-1.17%
jan 1, 1990
106.328
-1.271
-1.18%
jan 1, 1991
105.057
-1.271
-1.2%
jan 1, 1992
103.786
-1.271
-1.21%
jan 1, 1993
102.515
-1.271
-1.22%
jan 1, 1994
101.644
-0.871
-0.85%
jan 1, 1995
100.773
-0.871
-0.86%
jan 1, 1996
99.902
-0.871
-0.86%
jan 1, 1997
99.031
-0.871
-0.87%
jan 1, 1998
98.16
-0.871
-0.88%
jan 1, 1999
97.346
-0.814
-0.83%
jan 1, 2000
96.532
-0.814
-0.84%
jan 1, 2001
95.718
-0.814
-0.84%
jan 1, 2002
94.904
-0.814
-0.85%
jan 1, 2003
94.09
-0.814
-0.86%
jan 1, 2004
93.209
-0.881
-0.94%
jan 1, 2005
92.328
-0.881
-0.95%
jan 1, 2006
91.448
-0.88
-0.95%
jan 1, 2007
90.567
-0.881
-0.96%
jan 1, 2008
89.686
-0.881
-0.97%
jan 1, 2009
87.335
-2.351
-2.62%
jan 1, 2010
84.985
-2.35
-2.69%
jan 1, 2011
82.634
-2.351
-2.77%
jan 1, 2012
80.283
-2.351
-2.85%
jan 1, 2013
77.932
-2.351
-2.93%
jan 1, 2014
76.718
-1.214
-1.56%
jan 1, 2015
75.503
-1.215
-1.58%
Ranking of countries by current statistics by years


Comments: