29
/
en
AIzaSyAYiBZKx7MnpbEhh9jyipgxe19OcubqV5w
April 1, 2024
105176
Chile
CHL
true
2
1
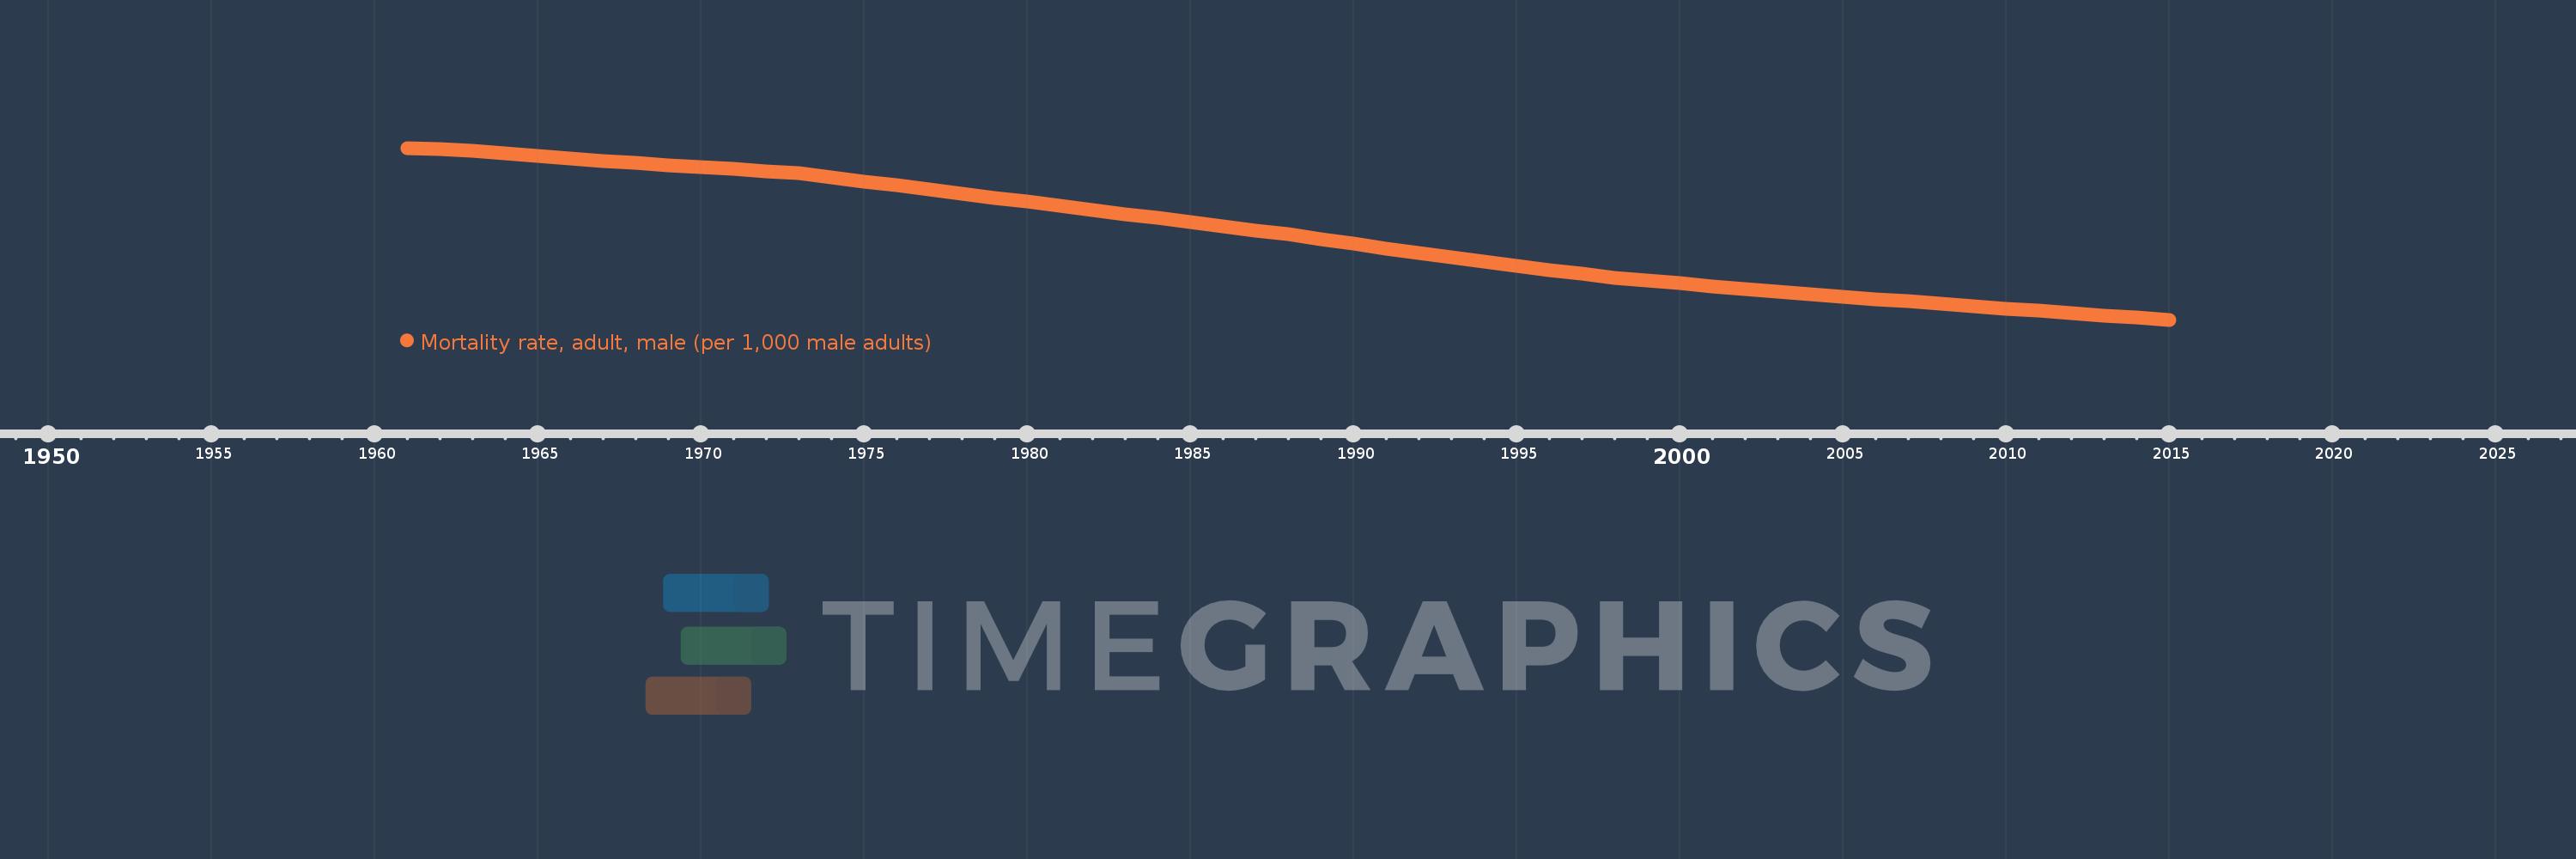
Mortality rate, adult, male (per 1,000 male adults)
2015,2014,2013,2012,2011,2010,2009,2008,2007,2006,2005,2004,2003,2002,2001,2000,1999,1998,1997,1996,1995,1994,1993,1992,1991,1990,1989,1988,1987,1986,1985,1984,1983,1982,1981,1980,1979,1978,1977,1976,1975,1974,1973,1972,1971,1970,1969,1968,1967,1966,1965,1964,1963,1962,1961
This statistics in other country:
AfghanistanAlbaniaAlgeriaAngolaAntigua and BarbudaArab WorldArgentinaArmeniaArubaAustraliaAustriaAzerbaijanBahamas, TheBahrainBangladeshBarbadosBelarusBelgiumBelizeBeninBhutanBoliviaBosnia and HerzegovinaBotswanaBrazilBrunei DarussalamBulgariaBurkina FasoBurundiCabo VerdeCambodiaCameroonCanadaCaribbean small statesCentral African RepublicCentral Europe and the BalticsChadChannel IslandsChileChinaColombiaComorosCongo, Dem. Rep.Congo, Rep.Costa RicaCote d'IvoireCroatiaCubaCuracaoCyprusCzech RepublicDenmarkDjiboutiDominicaDominican RepublicEarly-demographic dividendEast Asia & PacificEast Asia & Pacific (excluding high income)East Asia & Pacific (IDA & IBRD countries)EcuadorEgypt, Arab Rep.El SalvadorEquatorial GuineaEritreaEstoniaEthiopiaEuro areaEurope & Central AsiaEurope & Central Asia (excluding high income)Europe & Central Asia (IDA & IBRD countries)European UnionFijiFinlandFragile and conflict affected situationsFranceFrench PolynesiaGabonGambia, TheGeorgiaGermanyGhanaGreeceGreenlandGrenadaGuamGuatemalaGuineaGuinea-BissauGuyanaHaitiHeavily indebted poor countries (HIPC)High incomeHondurasHong Kong SAR, ChinaHungaryIBRD onlyIcelandIDA & IBRD totalIDA blendIDA onlyIDA totalIndiaIndonesiaIran, Islamic Rep.IraqIrelandIsraelItalyJamaicaJapanJordanKazakhstanKenyaKiribatiKorea, Dem. People’s Rep.Korea, Rep.KuwaitKyrgyz RepublicLao PDRLate-demographic dividendLatin America & Caribbean Latin America & Caribbean (excluding high income)Latin America & the Caribbean (IDA & IBRD countries)LatviaLeast developed countries: UN classificationLebanonLesothoLiberiaLibyaLithuaniaLow & middle incomeLow incomeLower middle incomeLuxembourgMacao SAR, ChinaMacedonia, FYRMadagascarMalawiMalaysiaMaldivesMaliMaltaMarshall IslandsMauritaniaMauritiusMexicoMicronesia, Fed. Sts.Middle East & North AfricaMiddle East & North Africa (excluding high income)Middle East & North Africa (IDA & IBRD countries)Middle incomeMoldovaMongoliaMontenegroMoroccoMozambiqueMyanmarNamibiaNepalNetherlandsNew CaledoniaNew ZealandNicaraguaNigerNigeriaNorth AmericaNorwayOECD membersOmanOther small statesPacific island small statesPakistanPanamaPapua New GuineaParaguayPeruPhilippinesPolandPortugalPost-demographic dividendPre-demographic dividendPuerto RicoQatarRomaniaRussian FederationRwandaSamoaSao Tome and PrincipeSaudi ArabiaSenegalSerbiaSeychellesSierra LeoneSingaporeSlovak RepublicSloveniaSmall statesSolomon IslandsSomaliaSouth AfricaSouth AsiaSouth Asia (IDA & IBRD)South SudanSpainSri LankaSt. Kitts and NevisSt. LuciaSt. Vincent and the GrenadinesSub-Saharan Africa Sub-Saharan Africa (excluding high income)Sub-Saharan Africa (IDA & IBRD countries)SudanSurinameSwazilandSwedenSwitzerlandSyrian Arab RepublicTajikistanTanzaniaThailandTimor-LesteTogoTongaTrinidad and TobagoTunisiaTurkeyTurkmenistanUgandaUkraineUnited Arab EmiratesUnited KingdomUnited StatesUpper middle incomeUruguayUzbekistanVanuatuVenezuela, RBVietnamVirgin Islands (U.S.)West Bank and GazaWorldYemen, Rep.ZambiaZimbabwe Timeline:
This timeline shows a graph from 1961 to 2015 of Chile. No data until 1960. Number of actual observations by date: 55.
Source name:
World Development Indicators
Source organization:
(1) United Nations Population Division. World Population Prospects. New York, United Nations, Department of Economic and Social Affairs (advanced Excel tables). Available at http://esa.un.org/wpp/unpp/panel_population.htm, (2) University of California, Berkeley, and Max Planck Institute for Demographic Research. Human Mortality Database. [ www.mortality.org or www.humanmortality.de].
Categories, topics:
Health, Gender
Last updated:
apr 23, 2017
Indicators value changes by year
Minimum:
95.543
jan 1, 2015
Maximum:
311.105
jan 1, 1961
At the date of observation
Value
Absolute change
Change from previous value
jan 1, 1961
311.105
+311.105
0.0%
jan 1, 1962
309.326
-1.779
-0.57%
jan 1, 1963
307.547
-1.779
-0.58%
jan 1, 1964
304.441
-3.106
-1.01%
jan 1, 1965
301.336
-3.105
-1.02%
jan 1, 1966
298.23
-3.106
-1.03%
jan 1, 1967
295.124
-3.106
-1.04%
jan 1, 1968
292.018
-3.106
-1.05%
jan 1, 1969
289.496
-2.522
-0.86%
jan 1, 1970
286.974
-2.522
-0.87%
jan 1, 1971
284.452
-2.522
-0.88%
jan 1, 1972
281.93
-2.522
-0.89%
jan 1, 1973
279.408
-2.522
-0.89%
jan 1, 1974
274.265
-5.143
-1.84%
jan 1, 1975
269.121
-5.144
-1.88%
jan 1, 1976
263.977
-5.144
-1.91%
jan 1, 1977
258.834
-5.143
-1.95%
jan 1, 1978
253.69
-5.144
-1.99%
jan 1, 1979
248.558
-5.132
-2.02%
jan 1, 1980
243.425
-5.133
-2.07%
jan 1, 1981
238.292
-5.133
-2.11%
jan 1, 1982
233.16
-5.132
-2.15%
jan 1, 1983
228.027
-5.133
-2.2%
jan 1, 1984
222.95
-5.077
-2.23%
jan 1, 1985
217.874
-5.076
-2.28%
jan 1, 1986
212.797
-5.077
-2.33%
jan 1, 1987
207.72
-5.077
-2.39%
jan 1, 1988
202.643
-5.077
-2.44%
jan 1, 1989
196.8
-5.843
-2.88%
jan 1, 1990
190.957
-5.843
-2.97%
jan 1, 1991
185.115
-5.842
-3.06%
jan 1, 1992
179.272
-5.843
-3.16%
jan 1, 1993
173.429
-5.843
-3.26%
jan 1, 1994
168.322
-5.107
-2.94%
jan 1, 1995
163.216
-5.106
-3.03%
jan 1, 1996
158.11
-5.106
-3.13%
jan 1, 1997
153.003
-5.107
-3.23%
jan 1, 1998
147.897
-5.106
-3.34%
jan 1, 1999
144.477
-3.42
-2.31%
jan 1, 2000
141.058
-3.419
-2.37%
jan 1, 2001
137.639
-3.419
-2.42%
jan 1, 2002
134.22
-3.419
-2.48%
jan 1, 2003
130.8
-3.42
-2.55%
jan 1, 2004
127.716
-3.084
-2.36%
jan 1, 2005
124.631
-3.085
-2.42%
jan 1, 2006
121.546
-3.085
-2.48%
jan 1, 2007
118.462
-3.084
-2.54%
jan 1, 2008
115.377
-3.085
-2.6%
jan 1, 2009
112.496
-2.881
-2.5%
jan 1, 2010
109.614
-2.882
-2.56%
jan 1, 2011
106.733
-2.881
-2.63%
jan 1, 2012
103.852
-2.881
-2.7%
jan 1, 2013
100.97
-2.882
-2.78%
jan 1, 2014
98.257
-2.713
-2.69%
jan 1, 2015
95.543
-2.714
-2.76%
Ranking of countries by current statistics by years


Comments: