29
/
en
AIzaSyAYiBZKx7MnpbEhh9jyipgxe19OcubqV5w
April 1, 2024
128548
Eritrea
ERI
true
2
1
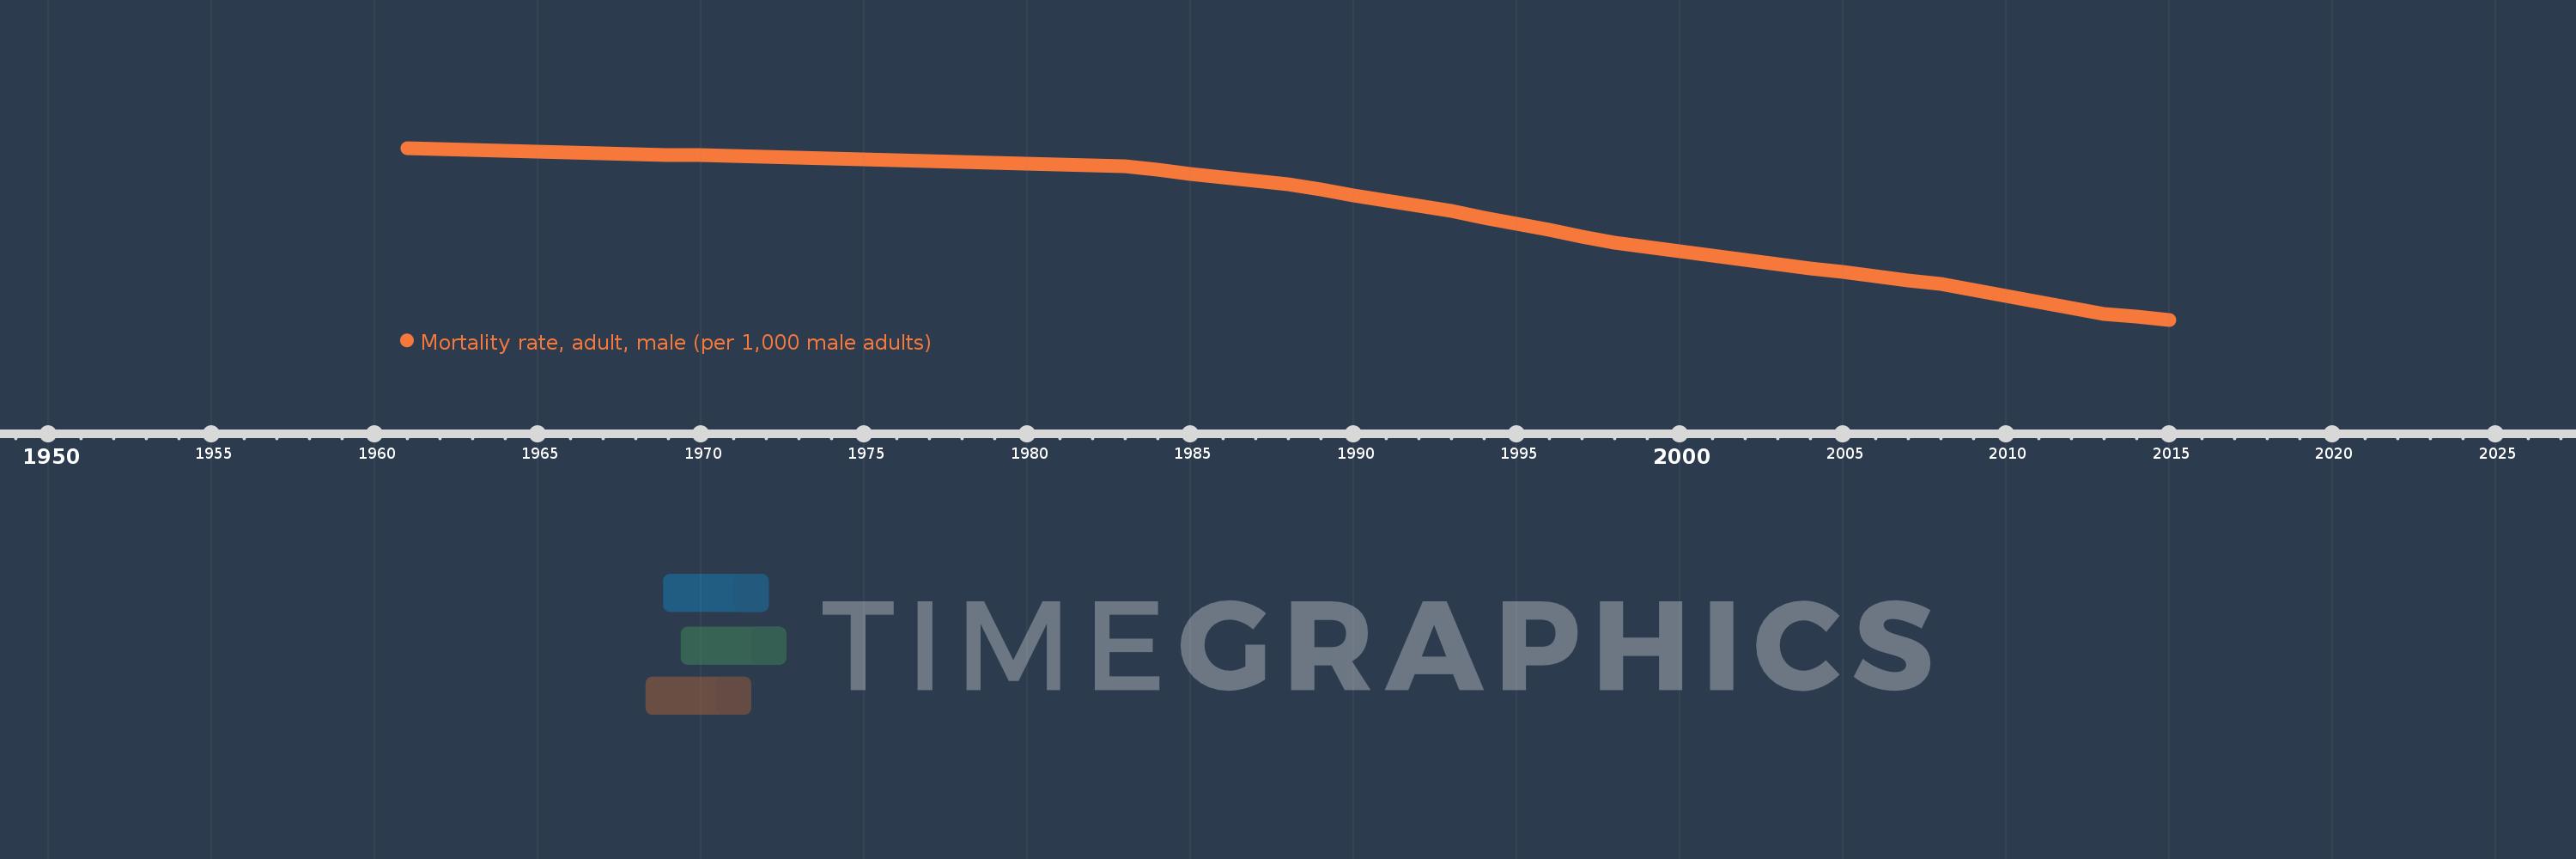
Mortality rate, adult, male (per 1,000 male adults)
2015,2014,2013,2012,2011,2010,2009,2008,2007,2006,2005,2004,2003,2002,2001,2000,1999,1998,1997,1996,1995,1994,1993,1992,1991,1990,1989,1988,1987,1986,1985,1984,1983,1982,1981,1980,1979,1978,1977,1976,1975,1974,1973,1972,1971,1970,1969,1968,1967,1966,1965,1964,1963,1962,1961
This statistics in other country:
AfghanistanAlbaniaAlgeriaAngolaAntigua and BarbudaArab WorldArgentinaArmeniaArubaAustraliaAustriaAzerbaijanBahamas, TheBahrainBangladeshBarbadosBelarusBelgiumBelizeBeninBhutanBoliviaBosnia and HerzegovinaBotswanaBrazilBrunei DarussalamBulgariaBurkina FasoBurundiCabo VerdeCambodiaCameroonCanadaCaribbean small statesCentral African RepublicCentral Europe and the BalticsChadChannel IslandsChileChinaColombiaComorosCongo, Dem. Rep.Congo, Rep.Costa RicaCote d'IvoireCroatiaCubaCuracaoCyprusCzech RepublicDenmarkDjiboutiDominicaDominican RepublicEarly-demographic dividendEast Asia & PacificEast Asia & Pacific (excluding high income)East Asia & Pacific (IDA & IBRD countries)EcuadorEgypt, Arab Rep.El SalvadorEquatorial GuineaEritreaEstoniaEthiopiaEuro areaEurope & Central AsiaEurope & Central Asia (excluding high income)Europe & Central Asia (IDA & IBRD countries)European UnionFijiFinlandFragile and conflict affected situationsFranceFrench PolynesiaGabonGambia, TheGeorgiaGermanyGhanaGreeceGreenlandGrenadaGuamGuatemalaGuineaGuinea-BissauGuyanaHaitiHeavily indebted poor countries (HIPC)High incomeHondurasHong Kong SAR, ChinaHungaryIBRD onlyIcelandIDA & IBRD totalIDA blendIDA onlyIDA totalIndiaIndonesiaIran, Islamic Rep.IraqIrelandIsraelItalyJamaicaJapanJordanKazakhstanKenyaKiribatiKorea, Dem. People’s Rep.Korea, Rep.KuwaitKyrgyz RepublicLao PDRLate-demographic dividendLatin America & Caribbean Latin America & Caribbean (excluding high income)Latin America & the Caribbean (IDA & IBRD countries)LatviaLeast developed countries: UN classificationLebanonLesothoLiberiaLibyaLithuaniaLow & middle incomeLow incomeLower middle incomeLuxembourgMacao SAR, ChinaMacedonia, FYRMadagascarMalawiMalaysiaMaldivesMaliMaltaMarshall IslandsMauritaniaMauritiusMexicoMicronesia, Fed. Sts.Middle East & North AfricaMiddle East & North Africa (excluding high income)Middle East & North Africa (IDA & IBRD countries)Middle incomeMoldovaMongoliaMontenegroMoroccoMozambiqueMyanmarNamibiaNepalNetherlandsNew CaledoniaNew ZealandNicaraguaNigerNigeriaNorth AmericaNorwayOECD membersOmanOther small statesPacific island small statesPakistanPanamaPapua New GuineaParaguayPeruPhilippinesPolandPortugalPost-demographic dividendPre-demographic dividendPuerto RicoQatarRomaniaRussian FederationRwandaSamoaSao Tome and PrincipeSaudi ArabiaSenegalSerbiaSeychellesSierra LeoneSingaporeSlovak RepublicSloveniaSmall statesSolomon IslandsSomaliaSouth AfricaSouth AsiaSouth Asia (IDA & IBRD)South SudanSpainSri LankaSt. Kitts and NevisSt. LuciaSt. Vincent and the GrenadinesSub-Saharan Africa Sub-Saharan Africa (excluding high income)Sub-Saharan Africa (IDA & IBRD countries)SudanSurinameSwazilandSwedenSwitzerlandSyrian Arab RepublicTajikistanTanzaniaThailandTimor-LesteTogoTongaTrinidad and TobagoTunisiaTurkeyTurkmenistanUgandaUkraineUnited Arab EmiratesUnited KingdomUnited StatesUpper middle incomeUruguayUzbekistanVanuatuVenezuela, RBVietnamVirgin Islands (U.S.)West Bank and GazaWorldYemen, Rep.ZambiaZimbabwe Timeline:
This timeline shows a graph from 1961 to 2015 of Eritrea. No data until 1960. Number of actual observations by date: 55.
Source name:
World Development Indicators
Source organization:
(1) United Nations Population Division. World Population Prospects. New York, United Nations, Department of Economic and Social Affairs (advanced Excel tables). Available at http://esa.un.org/wpp/unpp/panel_population.htm, (2) University of California, Berkeley, and Max Planck Institute for Demographic Research. Human Mortality Database. [ www.mortality.org or www.humanmortality.de].
Categories, topics:
Health, Gender
Last updated:
apr 23, 2017
Indicators value changes by year
Minimum:
295.398
jan 1, 2015
Maximum:
636.297
jan 1, 1961
At the date of observation
Value
Absolute change
Change from previous value
jan 1, 1961
636.297
+636.297
0.0%
jan 1, 1962
634.627
-1.67
-0.26%
jan 1, 1963
632.957
-1.67
-0.26%
jan 1, 1964
631.292
-1.665
-0.26%
jan 1, 1965
629.627
-1.665
-0.26%
jan 1, 1966
627.963
-1.664
-0.26%
jan 1, 1967
626.298
-1.665
-0.27%
jan 1, 1968
624.633
-1.665
-0.27%
jan 1, 1969
622.975
-1.658
-0.27%
jan 1, 1970
621.317
-1.658
-0.27%
jan 1, 1971
619.658
-1.659
-0.27%
jan 1, 1972
618.0
-1.658
-0.27%
jan 1, 1973
616.342
-1.658
-0.27%
jan 1, 1974
614.691
-1.651
-0.27%
jan 1, 1975
613.04
-1.651
-0.27%
jan 1, 1976
611.388
-1.652
-0.27%
jan 1, 1977
609.737
-1.651
-0.27%
jan 1, 1978
608.086
-1.651
-0.27%
jan 1, 1979
606.443
-1.643
-0.27%
jan 1, 1980
604.8
-1.643
-0.27%
jan 1, 1981
603.156
-1.644
-0.27%
jan 1, 1982
601.513
-1.643
-0.27%
jan 1, 1983
599.87
-1.643
-0.27%
jan 1, 1984
592.667
-7.203
-1.2%
jan 1, 1985
585.464
-7.203
-1.22%
jan 1, 1986
578.262
-7.202
-1.23%
jan 1, 1987
571.059
-7.203
-1.25%
jan 1, 1988
563.857
-7.202
-1.26%
jan 1, 1989
553.243
-10.614
-1.88%
jan 1, 1990
542.63
-10.613
-1.92%
jan 1, 1991
532.016
-10.614
-1.96%
jan 1, 1992
521.403
-10.613
-1.99%
jan 1, 1993
510.79
-10.613
-2.04%
jan 1, 1994
498.328
-12.462
-2.44%
jan 1, 1995
485.867
-12.461
-2.5%
jan 1, 1996
473.406
-12.461
-2.56%
jan 1, 1997
460.945
-12.461
-2.63%
jan 1, 1998
448.484
-12.461
-2.7%
jan 1, 1999
439.875
-8.609
-1.92%
jan 1, 2000
431.267
-8.608
-1.96%
jan 1, 2001
422.659
-8.608
-2.0%
jan 1, 2002
414.05
-8.609
-2.04%
jan 1, 2003
405.442
-8.608
-2.08%
jan 1, 2004
397.572
-7.87
-1.94%
jan 1, 2005
389.702
-7.87
-1.98%
jan 1, 2006
381.832
-7.87
-2.02%
jan 1, 2007
373.961
-7.871
-2.06%
jan 1, 2008
366.091
-7.87
-2.1%
jan 1, 2009
354.218
-11.873
-3.24%
jan 1, 2010
342.345
-11.873
-3.35%
jan 1, 2011
330.472
-11.873
-3.47%
jan 1, 2012
318.599
-11.873
-3.59%
jan 1, 2013
306.726
-11.873
-3.73%
jan 1, 2014
301.062
-5.664
-1.85%
jan 1, 2015
295.398
-5.664
-1.88%
Ranking of countries by current statistics by years


Comments: