29
/
en
AIzaSyAYiBZKx7MnpbEhh9jyipgxe19OcubqV5w
April 1, 2024
197872
Moldova
MDA
true
2
1
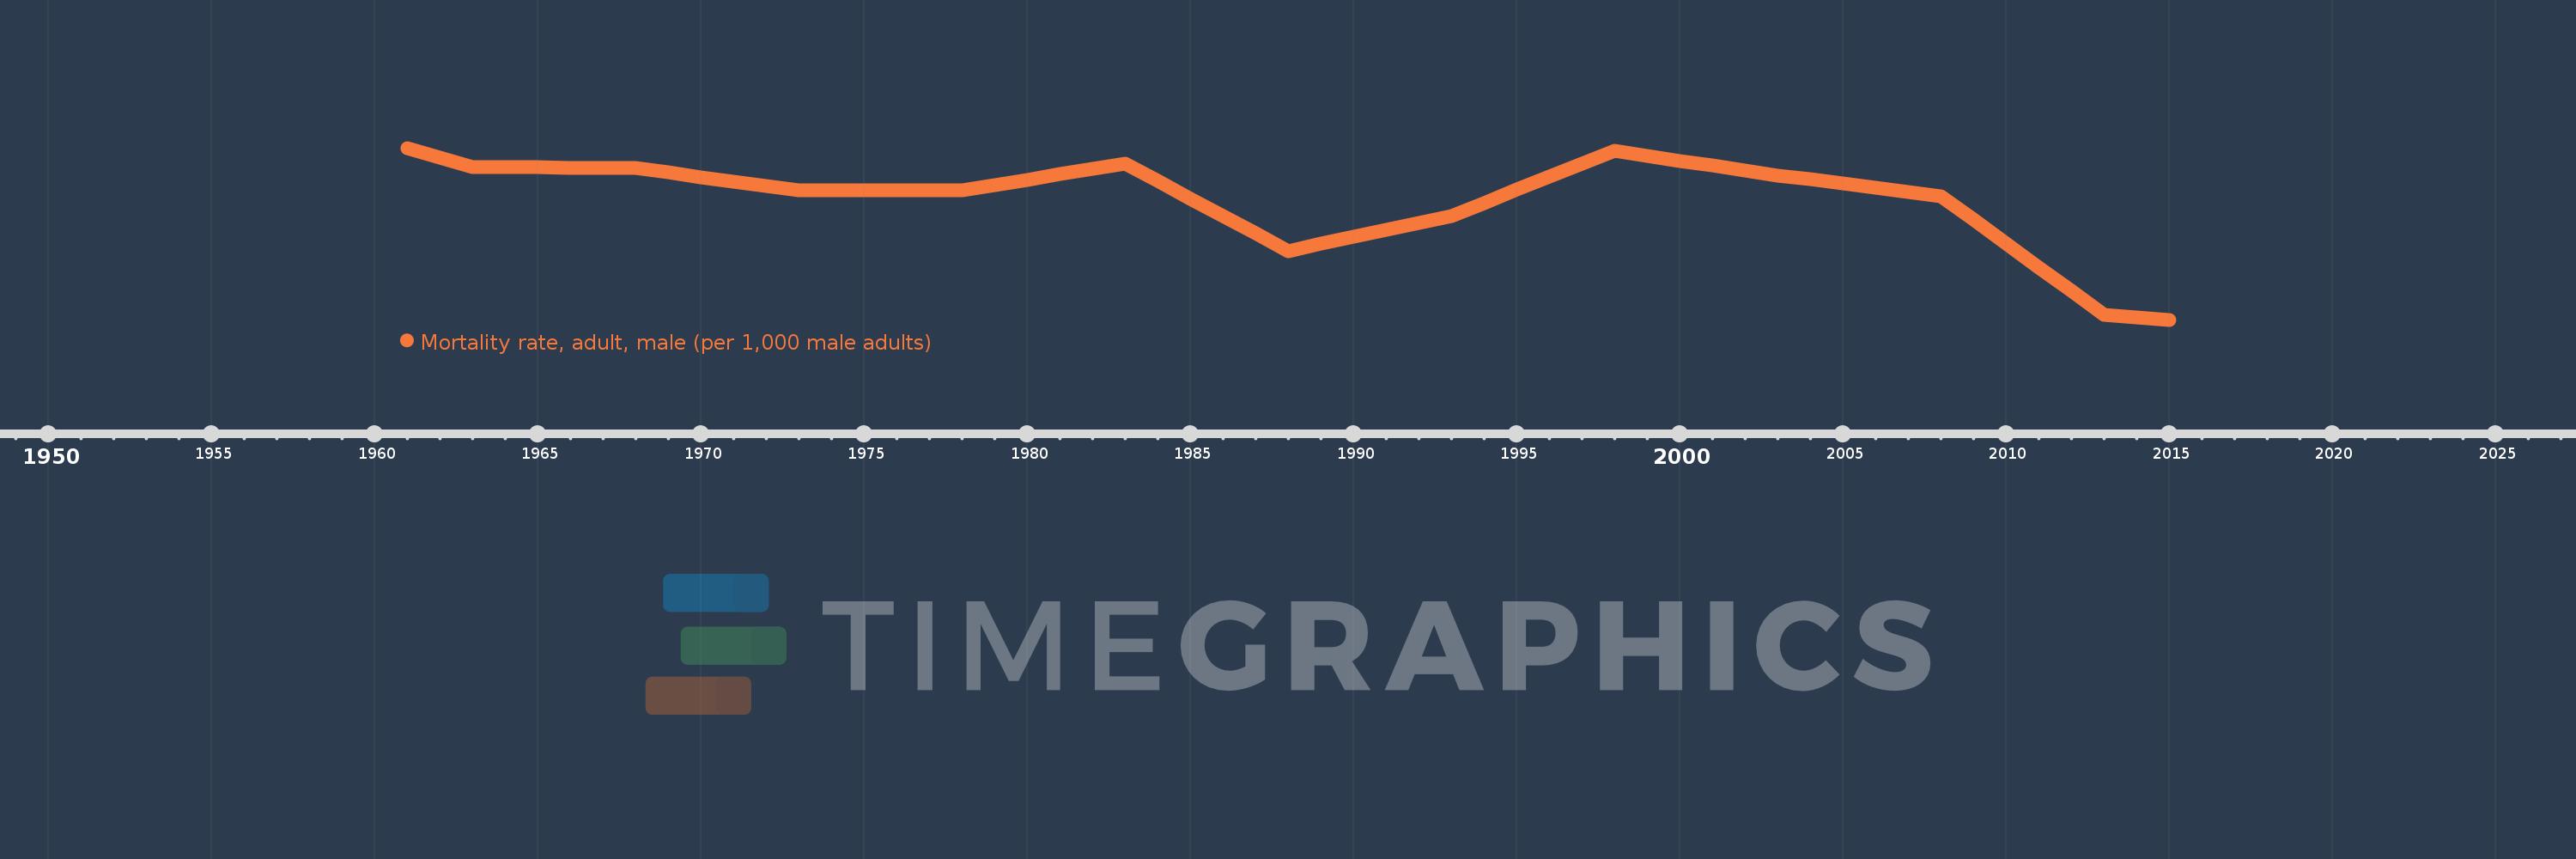
Mortality rate, adult, male (per 1,000 male adults)
2015,2014,2013,2012,2011,2010,2009,2008,2007,2006,2005,2004,2003,2002,2001,2000,1999,1998,1997,1996,1995,1994,1993,1992,1991,1990,1989,1988,1987,1986,1985,1984,1983,1982,1981,1980,1979,1978,1977,1976,1975,1974,1973,1972,1971,1970,1969,1968,1967,1966,1965,1964,1963,1962,1961
This statistics in other country:
AfghanistanAlbaniaAlgeriaAngolaAntigua and BarbudaArab WorldArgentinaArmeniaArubaAustraliaAustriaAzerbaijanBahamas, TheBahrainBangladeshBarbadosBelarusBelgiumBelizeBeninBhutanBoliviaBosnia and HerzegovinaBotswanaBrazilBrunei DarussalamBulgariaBurkina FasoBurundiCabo VerdeCambodiaCameroonCanadaCaribbean small statesCentral African RepublicCentral Europe and the BalticsChadChannel IslandsChileChinaColombiaComorosCongo, Dem. Rep.Congo, Rep.Costa RicaCote d'IvoireCroatiaCubaCuracaoCyprusCzech RepublicDenmarkDjiboutiDominicaDominican RepublicEarly-demographic dividendEast Asia & PacificEast Asia & Pacific (excluding high income)East Asia & Pacific (IDA & IBRD countries)EcuadorEgypt, Arab Rep.El SalvadorEquatorial GuineaEritreaEstoniaEthiopiaEuro areaEurope & Central AsiaEurope & Central Asia (excluding high income)Europe & Central Asia (IDA & IBRD countries)European UnionFijiFinlandFragile and conflict affected situationsFranceFrench PolynesiaGabonGambia, TheGeorgiaGermanyGhanaGreeceGreenlandGrenadaGuamGuatemalaGuineaGuinea-BissauGuyanaHaitiHeavily indebted poor countries (HIPC)High incomeHondurasHong Kong SAR, ChinaHungaryIBRD onlyIcelandIDA & IBRD totalIDA blendIDA onlyIDA totalIndiaIndonesiaIran, Islamic Rep.IraqIrelandIsraelItalyJamaicaJapanJordanKazakhstanKenyaKiribatiKorea, Dem. People’s Rep.Korea, Rep.KuwaitKyrgyz RepublicLao PDRLate-demographic dividendLatin America & Caribbean Latin America & Caribbean (excluding high income)Latin America & the Caribbean (IDA & IBRD countries)LatviaLeast developed countries: UN classificationLebanonLesothoLiberiaLibyaLithuaniaLow & middle incomeLow incomeLower middle incomeLuxembourgMacao SAR, ChinaMacedonia, FYRMadagascarMalawiMalaysiaMaldivesMaliMaltaMarshall IslandsMauritaniaMauritiusMexicoMicronesia, Fed. Sts.Middle East & North AfricaMiddle East & North Africa (excluding high income)Middle East & North Africa (IDA & IBRD countries)Middle incomeMoldovaMongoliaMontenegroMoroccoMozambiqueMyanmarNamibiaNepalNetherlandsNew CaledoniaNew ZealandNicaraguaNigerNigeriaNorth AmericaNorwayOECD membersOmanOther small statesPacific island small statesPakistanPanamaPapua New GuineaParaguayPeruPhilippinesPolandPortugalPost-demographic dividendPre-demographic dividendPuerto RicoQatarRomaniaRussian FederationRwandaSamoaSao Tome and PrincipeSaudi ArabiaSenegalSerbiaSeychellesSierra LeoneSingaporeSlovak RepublicSloveniaSmall statesSolomon IslandsSomaliaSouth AfricaSouth AsiaSouth Asia (IDA & IBRD)South SudanSpainSri LankaSt. Kitts and NevisSt. LuciaSt. Vincent and the GrenadinesSub-Saharan Africa Sub-Saharan Africa (excluding high income)Sub-Saharan Africa (IDA & IBRD countries)SudanSurinameSwazilandSwedenSwitzerlandSyrian Arab RepublicTajikistanTanzaniaThailandTimor-LesteTogoTongaTrinidad and TobagoTunisiaTurkeyTurkmenistanUgandaUkraineUnited Arab EmiratesUnited KingdomUnited StatesUpper middle incomeUruguayUzbekistanVanuatuVenezuela, RBVietnamVirgin Islands (U.S.)West Bank and GazaWorldYemen, Rep.ZambiaZimbabwe Timeline:
This timeline shows a graph from 1961 to 2015 of Moldova. No data until 1960. Number of actual observations by date: 55.
Source name:
World Development Indicators
Source organization:
(1) United Nations Population Division. World Population Prospects. New York, United Nations, Department of Economic and Social Affairs (advanced Excel tables). Available at http://esa.un.org/wpp/unpp/panel_population.htm, (2) University of California, Berkeley, and Max Planck Institute for Demographic Research. Human Mortality Database. [ www.mortality.org or www.humanmortality.de].
Categories, topics:
Health, Gender
Last updated:
apr 23, 2017
Indicators value changes by year
Minimum:
243.69
jan 1, 2015
Maximum:
332.225
jan 1, 1961
At the date of observation
Value
Absolute change
Change from previous value
jan 1, 1961
332.225
+332.225
0.0%
jan 1, 1962
327.393
-4.832
-1.45%
jan 1, 1963
322.561
-4.832
-1.48%
jan 1, 1964
322.403
-0.158
-0.05%
jan 1, 1965
322.245
-0.158
-0.05%
jan 1, 1966
322.087
-0.158
-0.05%
jan 1, 1967
321.93
-0.157
-0.05%
jan 1, 1968
321.772
-0.158
-0.05%
jan 1, 1969
319.505
-2.267
-0.7%
jan 1, 1970
317.237
-2.268
-0.71%
jan 1, 1971
314.97
-2.267
-0.71%
jan 1, 1972
312.703
-2.267
-0.72%
jan 1, 1973
310.435
-2.268
-0.73%
jan 1, 1974
310.435
0.0
0.0%
jan 1, 1975
310.435
0.0
0.0%
jan 1, 1976
310.435
0.0
0.0%
jan 1, 1977
310.435
0.0
0.0%
jan 1, 1978
310.435
0.0
0.0%
jan 1, 1979
313.171
+2.736
0.88%
jan 1, 1980
315.906
+2.735
0.87%
jan 1, 1981
318.641
+2.735
0.87%
jan 1, 1982
321.377
+2.736
0.86%
jan 1, 1983
324.112
+2.735
0.85%
jan 1, 1984
315.121
-8.991
-2.77%
jan 1, 1985
306.13
-8.991
-2.85%
jan 1, 1986
297.139
-8.991
-2.94%
jan 1, 1987
288.148
-8.991
-3.03%
jan 1, 1988
279.157
-8.991
-3.12%
jan 1, 1989
282.775
+3.618
1.3%
jan 1, 1990
286.393
+3.618
1.28%
jan 1, 1991
290.011
+3.618
1.26%
jan 1, 1992
293.629
+3.618
1.25%
jan 1, 1993
297.246
+3.617
1.23%
jan 1, 1994
303.939
+6.693
2.25%
jan 1, 1995
310.631
+6.692
2.2%
jan 1, 1996
317.324
+6.693
2.15%
jan 1, 1997
324.016
+6.692
2.11%
jan 1, 1998
330.708
+6.692
2.07%
jan 1, 1999
328.187
-2.521
-0.76%
jan 1, 2000
325.665
-2.522
-0.77%
jan 1, 2001
323.143
-2.522
-0.77%
jan 1, 2002
320.621
-2.522
-0.78%
jan 1, 2003
318.099
-2.522
-0.79%
jan 1, 2004
315.979
-2.12
-0.67%
jan 1, 2005
313.859
-2.12
-0.67%
jan 1, 2006
311.74
-2.119
-0.68%
jan 1, 2007
309.62
-2.12
-0.68%
jan 1, 2008
307.5
-2.12
-0.68%
jan 1, 2009
295.25
-12.25
-3.98%
jan 1, 2010
283.0
-12.25
-4.15%
jan 1, 2011
270.75
-12.25
-4.33%
jan 1, 2012
258.501
-12.249
-4.52%
jan 1, 2013
246.251
-12.25
-4.74%
jan 1, 2014
244.97
-1.281
-0.52%
jan 1, 2015
243.69
-1.28
-0.52%
Ranking of countries by current statistics by years


Comments: