29
/
en
AIzaSyAYiBZKx7MnpbEhh9jyipgxe19OcubqV5w
April 1, 2024
175616
Latvia
LVA
true
2
1
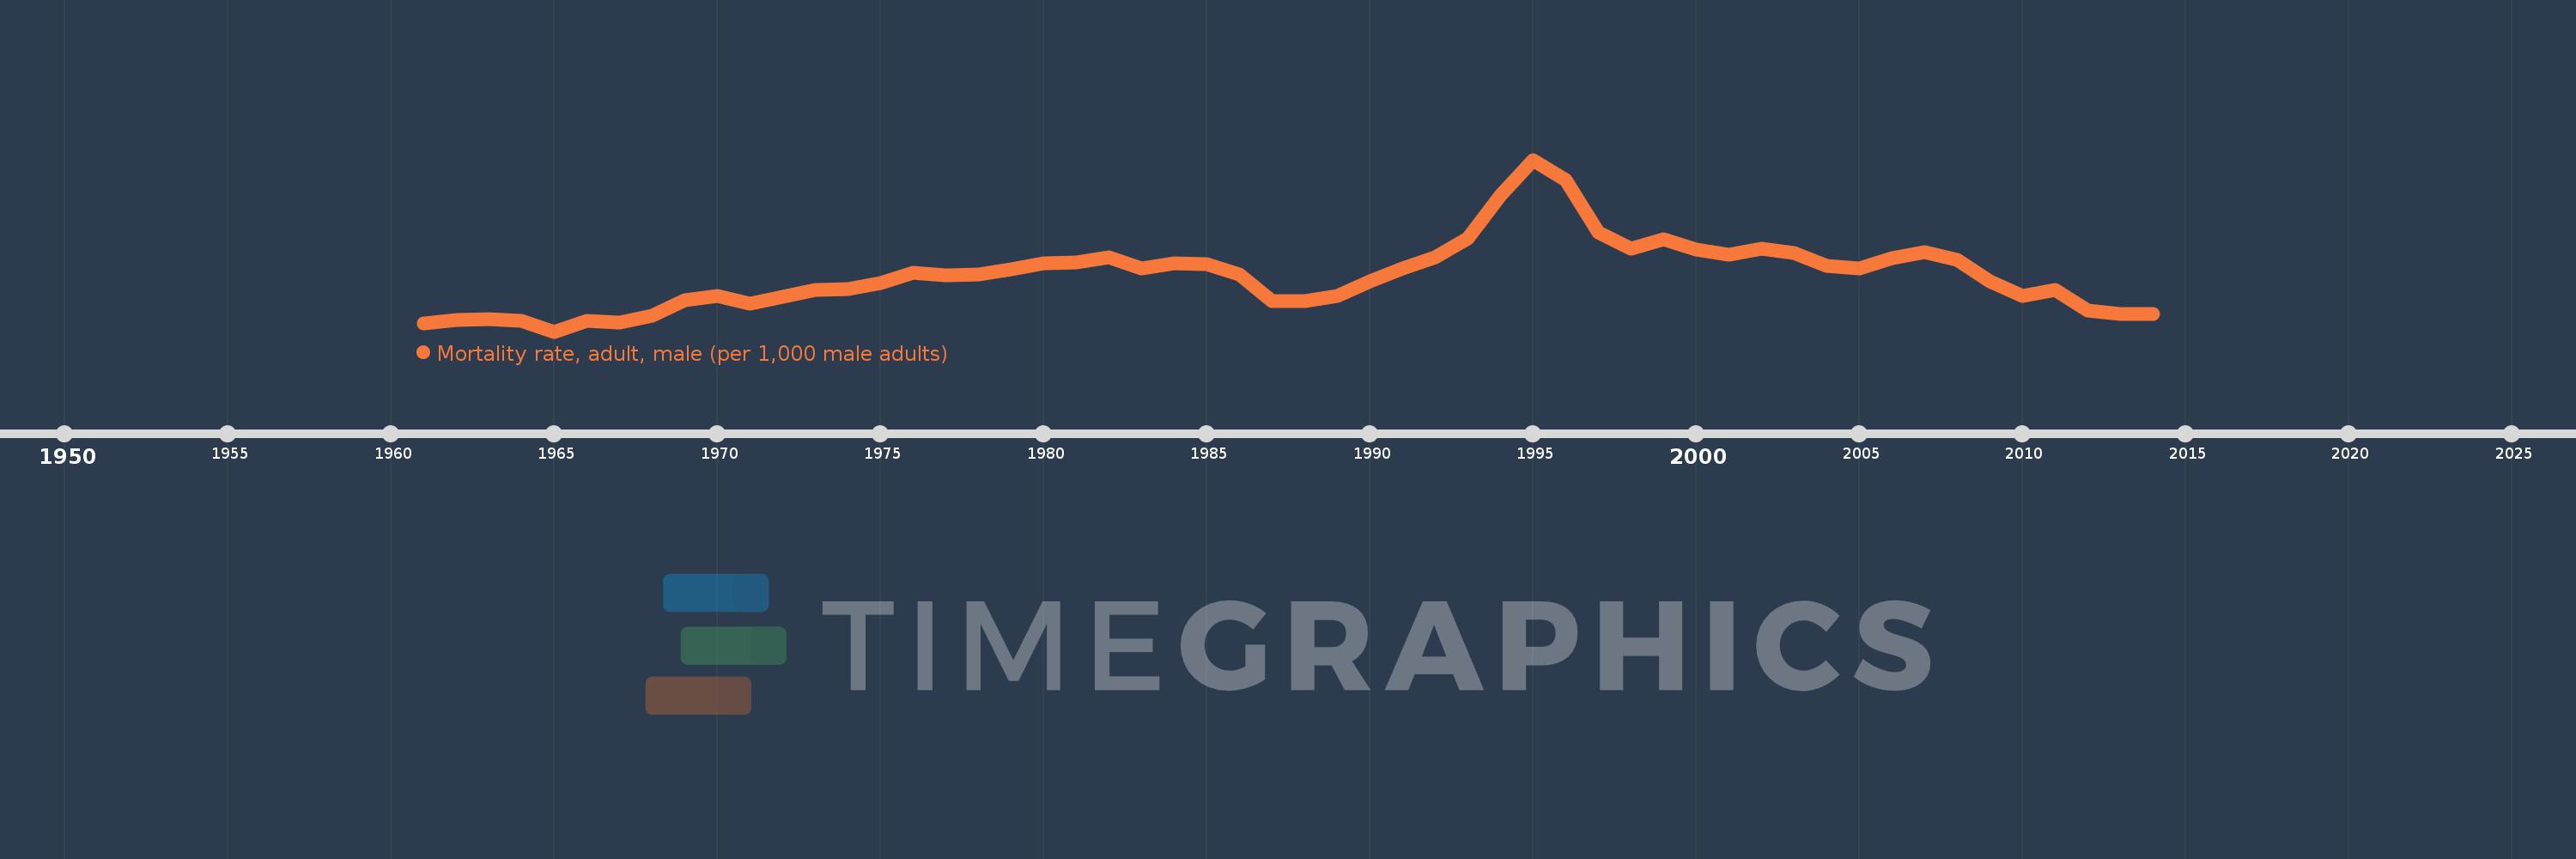
Mortality rate, adult, male (per 1,000 male adults)
2014,2013,2012,2011,2010,2009,2008,2007,2006,2005,2004,2003,2002,2001,2000,1999,1998,1997,1996,1995,1994,1993,1992,1991,1990,1989,1988,1987,1986,1985,1984,1983,1982,1981,1980,1979,1978,1977,1976,1975,1974,1973,1972,1971,1970,1969,1968,1967,1966,1965,1964,1963,1962,1961
This statistics in other country:
AfghanistanAlbaniaAlgeriaAngolaAntigua and BarbudaArab WorldArgentinaArmeniaArubaAustraliaAustriaAzerbaijanBahamas, TheBahrainBangladeshBarbadosBelarusBelgiumBelizeBeninBhutanBoliviaBosnia and HerzegovinaBotswanaBrazilBrunei DarussalamBulgariaBurkina FasoBurundiCabo VerdeCambodiaCameroonCanadaCaribbean small statesCentral African RepublicCentral Europe and the BalticsChadChannel IslandsChileChinaColombiaComorosCongo, Dem. Rep.Congo, Rep.Costa RicaCote d'IvoireCroatiaCubaCuracaoCyprusCzech RepublicDenmarkDjiboutiDominicaDominican RepublicEarly-demographic dividendEast Asia & PacificEast Asia & Pacific (excluding high income)East Asia & Pacific (IDA & IBRD countries)EcuadorEgypt, Arab Rep.El SalvadorEquatorial GuineaEritreaEstoniaEthiopiaEuro areaEurope & Central AsiaEurope & Central Asia (excluding high income)Europe & Central Asia (IDA & IBRD countries)European UnionFijiFinlandFragile and conflict affected situationsFranceFrench PolynesiaGabonGambia, TheGeorgiaGermanyGhanaGreeceGreenlandGrenadaGuamGuatemalaGuineaGuinea-BissauGuyanaHaitiHeavily indebted poor countries (HIPC)High incomeHondurasHong Kong SAR, ChinaHungaryIBRD onlyIcelandIDA & IBRD totalIDA blendIDA onlyIDA totalIndiaIndonesiaIran, Islamic Rep.IraqIrelandIsraelItalyJamaicaJapanJordanKazakhstanKenyaKiribatiKorea, Dem. People’s Rep.Korea, Rep.KuwaitKyrgyz RepublicLao PDRLate-demographic dividendLatin America & Caribbean Latin America & Caribbean (excluding high income)Latin America & the Caribbean (IDA & IBRD countries)LatviaLeast developed countries: UN classificationLebanonLesothoLiberiaLibyaLithuaniaLow & middle incomeLow incomeLower middle incomeLuxembourgMacao SAR, ChinaMacedonia, FYRMadagascarMalawiMalaysiaMaldivesMaliMaltaMarshall IslandsMauritaniaMauritiusMexicoMicronesia, Fed. Sts.Middle East & North AfricaMiddle East & North Africa (excluding high income)Middle East & North Africa (IDA & IBRD countries)Middle incomeMoldovaMongoliaMontenegroMoroccoMozambiqueMyanmarNamibiaNepalNetherlandsNew CaledoniaNew ZealandNicaraguaNigerNigeriaNorth AmericaNorwayOECD membersOmanOther small statesPacific island small statesPakistanPanamaPapua New GuineaParaguayPeruPhilippinesPolandPortugalPost-demographic dividendPre-demographic dividendPuerto RicoQatarRomaniaRussian FederationRwandaSamoaSao Tome and PrincipeSaudi ArabiaSenegalSerbiaSeychellesSierra LeoneSingaporeSlovak RepublicSloveniaSmall statesSolomon IslandsSomaliaSouth AfricaSouth AsiaSouth Asia (IDA & IBRD)South SudanSpainSri LankaSt. Kitts and NevisSt. LuciaSt. Vincent and the GrenadinesSub-Saharan Africa Sub-Saharan Africa (excluding high income)Sub-Saharan Africa (IDA & IBRD countries)SudanSurinameSwazilandSwedenSwitzerlandSyrian Arab RepublicTajikistanTanzaniaThailandTimor-LesteTogoTongaTrinidad and TobagoTunisiaTurkeyTurkmenistanUgandaUkraineUnited Arab EmiratesUnited KingdomUnited StatesUpper middle incomeUruguayUzbekistanVanuatuVenezuela, RBVietnamVirgin Islands (U.S.)West Bank and GazaWorldYemen, Rep.ZambiaZimbabwe Timeline:
This timeline shows a graph from 1961 to 2014 of Latvia. No data until 1960. Number of actual observations by date: 54.
Source name:
World Development Indicators
Source organization:
(1) United Nations Population Division. World Population Prospects. New York, United Nations, Department of Economic and Social Affairs (advanced Excel tables). Available at http://esa.un.org/wpp/unpp/panel_population.htm, (2) University of California, Berkeley, and Max Planck Institute for Demographic Research. Human Mortality Database. [ www.mortality.org or www.humanmortality.de].
Categories, topics:
Health, Gender
Last updated:
apr 23, 2017
Indicators value changes by year
Minimum:
217.24
jan 1, 1965
Maximum:
469.776
jan 1, 1995
At the date of observation
Value
Absolute change
Change from previous value
jan 1, 1961
229.759
+229.759
0.0%
jan 1, 1962
234.308
+4.549
1.98%
jan 1, 1963
236.172
+1.864
0.8%
jan 1, 1964
233.185
-2.987
-1.26%
jan 1, 1965
217.24
-15.945
-6.84%
jan 1, 1966
232.876
+15.636
7.2%
jan 1, 1967
230.763
-2.113
-0.91%
jan 1, 1968
240.129
+9.366
4.06%
jan 1, 1969
262.814
+22.685
9.45%
jan 1, 1970
270.017
+7.203
2.74%
jan 1, 1971
258.483
-11.534
-4.27%
jan 1, 1972
268.104
+9.621
3.72%
jan 1, 1973
279.089
+10.985
4.1%
jan 1, 1974
279.417
+0.328
0.12%
jan 1, 1975
288.799
+9.382
3.36%
jan 1, 1976
303.865
+15.066
5.22%
jan 1, 1977
300.035
-3.83
-1.26%
jan 1, 1978
301.079
+1.044
0.35%
jan 1, 1979
309.0
+7.921
2.63%
jan 1, 1980
318.005
+9.005
2.91%
jan 1, 1981
318.985
+0.98
0.31%
jan 1, 1982
326.604
+7.619
2.39%
jan 1, 1983
310.197
-16.407
-5.02%
jan 1, 1984
317.033
+6.836
2.2%
jan 1, 1985
315.841
-1.192
-0.38%
jan 1, 1986
300.683
-15.158
-4.8%
jan 1, 1987
261.769
-38.914
-12.94%
jan 1, 1988
262.412
+0.643
0.25%
jan 1, 1989
269.236
+6.824
2.6%
jan 1, 1990
291.387
+22.151
8.23%
jan 1, 1991
309.985
+18.598
6.38%
jan 1, 1992
326.531
+16.546
5.34%
jan 1, 1993
354.513
+27.982
8.57%
jan 1, 1994
417.269
+62.756
17.7%
jan 1, 1995
469.776
+52.507
12.58%
jan 1, 1996
439.578
-30.198
-6.43%
jan 1, 1997
362.46
-77.118
-17.54%
jan 1, 1998
339.009
-23.451
-6.47%
jan 1, 1999
353.273
+14.264
4.21%
jan 1, 2000
338.267
-15.006
-4.25%
jan 1, 2001
330.36
-7.907
-2.34%
jan 1, 2002
338.546
+8.186
2.48%
jan 1, 2003
332.341
-6.205
-1.83%
jan 1, 2004
314.198
-18.143
-5.46%
jan 1, 2005
310.539
-3.659
-1.16%
jan 1, 2006
325.543
+15.004
4.83%
jan 1, 2007
334.482
+8.939
2.75%
jan 1, 2008
322.288
-12.194
-3.65%
jan 1, 2009
291.201
-31.087
-9.65%
jan 1, 2010
269.513
-21.688
-7.45%
jan 1, 2011
278.927
+9.414
3.49%
jan 1, 2012
248.073
-30.854
-11.06%
jan 1, 2013
243.495
-4.578
-1.85%
jan 1, 2014
242.841
-0.654
-0.27%
Ranking of countries by current statistics by years


Comments: