29
/
en
AIzaSyAYiBZKx7MnpbEhh9jyipgxe19OcubqV5w
April 1, 2024
79854
Barbados
BRB
true
2
1
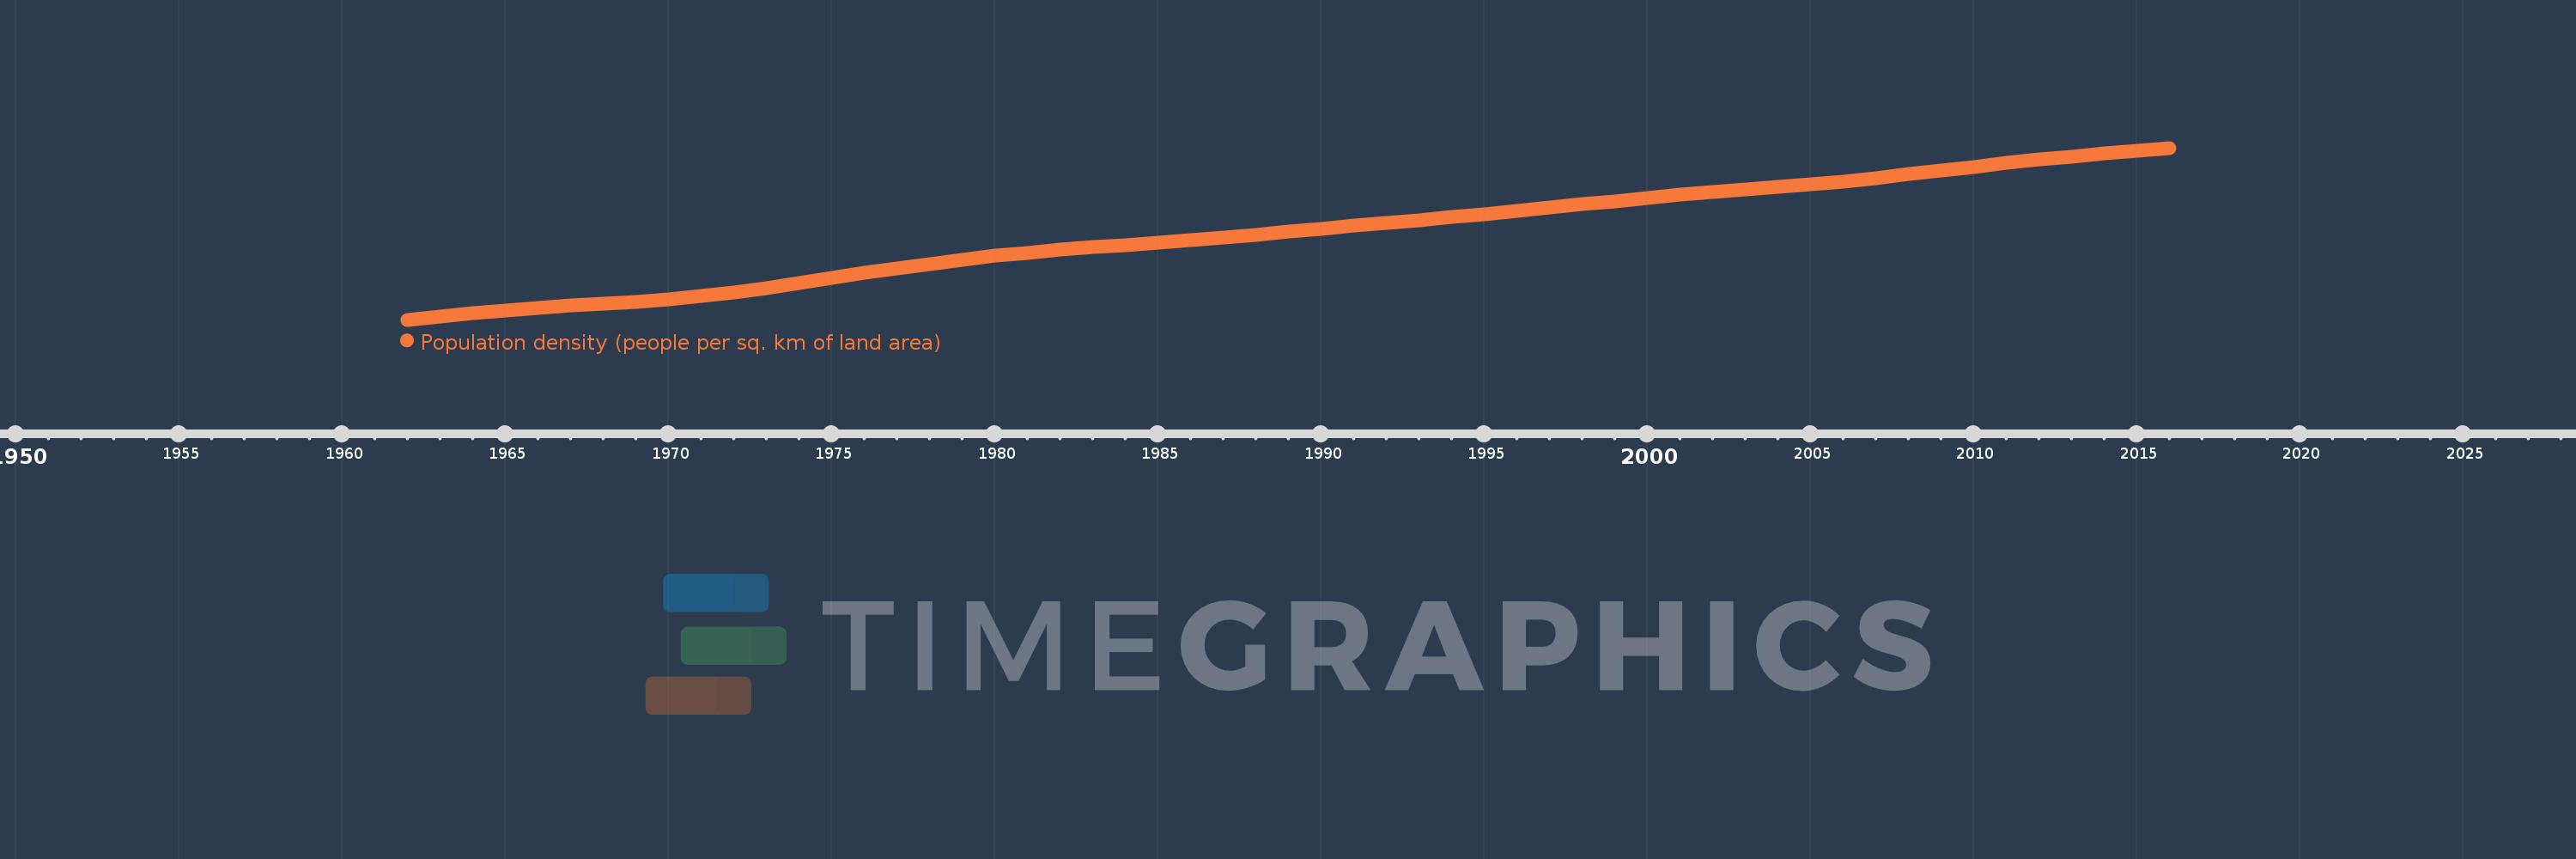
Population density (people per sq. km of land area)
2016,2015,2014,2013,2012,2011,2010,2009,2008,2007,2006,2005,2004,2003,2002,2001,2000,1999,1998,1997,1996,1995,1994,1993,1992,1991,1990,1989,1988,1987,1986,1985,1984,1983,1982,1981,1980,1979,1978,1977,1976,1975,1974,1973,1972,1971,1970,1969,1968,1967,1966,1965,1964,1963,1962
This statistics in other country:
AfghanistanAlbaniaAlgeriaAmerican SamoaAndorraAngolaAntigua and BarbudaArab WorldArgentinaArmeniaArubaAustraliaAustriaAzerbaijanBahamas, TheBahrainBangladeshBarbadosBelarusBelgiumBelizeBeninBermudaBhutanBoliviaBosnia and HerzegovinaBotswanaBrazilBritish Virgin IslandsBrunei DarussalamBulgariaBurkina FasoBurundiCabo VerdeCambodiaCameroonCanadaCaribbean small statesCayman IslandsCentral African RepublicCentral Europe and the BalticsChadChannel IslandsChileChinaColombiaComorosCongo, Dem. Rep.Congo, Rep.Costa RicaCote d'IvoireCroatiaCubaCuracaoCyprusCzech RepublicDenmarkDjiboutiDominicaDominican RepublicEarly-demographic dividendEast Asia & PacificEast Asia & Pacific (excluding high income)East Asia & Pacific (IDA & IBRD countries)EcuadorEgypt, Arab Rep.El SalvadorEquatorial GuineaEritreaEstoniaEthiopiaEuro areaEurope & Central AsiaEurope & Central Asia (excluding high income)Europe & Central Asia (IDA & IBRD countries)European UnionFaroe IslandsFijiFinlandFragile and conflict affected situationsFranceFrench PolynesiaGabonGambia, TheGeorgiaGermanyGhanaGibraltarGreeceGreenlandGrenadaGuamGuatemalaGuineaGuinea-BissauGuyanaHaitiHeavily indebted poor countries (HIPC)High incomeHondurasHong Kong SAR, ChinaHungaryIBRD onlyIcelandIDA & IBRD totalIDA blendIDA onlyIDA totalIndiaIndonesiaIran, Islamic Rep.IraqIrelandIsle of ManIsraelItalyJamaicaJapanJordanKazakhstanKenyaKiribatiKorea, Dem. People’s Rep.Korea, Rep.KosovoKuwaitKyrgyz RepublicLao PDRLate-demographic dividendLatin America & Caribbean Latin America & Caribbean (excluding high income)Latin America & the Caribbean (IDA & IBRD countries)LatviaLeast developed countries: UN classificationLebanonLesothoLiberiaLibyaLiechtensteinLithuaniaLow & middle incomeLow incomeLower middle incomeLuxembourgMacao SAR, ChinaMacedonia, FYRMadagascarMalawiMalaysiaMaldivesMaliMaltaMarshall IslandsMauritaniaMauritiusMexicoMicronesia, Fed. Sts.Middle East & North AfricaMiddle East & North Africa (excluding high income)Middle East & North Africa (IDA & IBRD countries)Middle incomeMoldovaMonacoMongoliaMontenegroMoroccoMozambiqueMyanmarNamibiaNauruNepalNetherlandsNew CaledoniaNew ZealandNicaraguaNigerNigeriaNorth AmericaNorthern Mariana IslandsNorwayOECD membersOmanOther small statesPacific island small statesPakistanPalauPanamaPapua New GuineaParaguayPeruPhilippinesPolandPortugalPost-demographic dividendPre-demographic dividendPuerto RicoQatarRomaniaRussian FederationRwandaSamoaSan MarinoSao Tome and PrincipeSaudi ArabiaSenegalSerbiaSeychellesSierra LeoneSingaporeSint Maarten (Dutch part)Slovak RepublicSloveniaSmall statesSolomon IslandsSomaliaSouth AfricaSouth AsiaSouth Asia (IDA & IBRD)SpainSri LankaSt. Kitts and NevisSt. LuciaSt. Martin (French part)St. Vincent and the GrenadinesSub-Saharan Africa Sub-Saharan Africa (excluding high income)Sub-Saharan Africa (IDA & IBRD countries)SudanSurinameSwazilandSwedenSwitzerlandSyrian Arab RepublicTajikistanTanzaniaThailandTimor-LesteTogoTongaTrinidad and TobagoTunisiaTurkeyTurkmenistanTurks and Caicos IslandsTuvaluUgandaUkraineUnited Arab EmiratesUnited KingdomUnited StatesUpper middle incomeUruguayUzbekistanVanuatuVenezuela, RBVietnamVirgin Islands (U.S.)West Bank and GazaWorldYemen, Rep.ZambiaZimbabwe Timeline:
This timeline shows a graph from 1962 to 2016 of Barbados. No data until 1961. Number of actual observations by date: 55.
Source name:
World Development Indicators
Source organization:
Food and Agriculture Organization and World Bank population estimates.
Categories, topics:
Urban Development
Last updated:
apr 23, 2017
Indicators value changes by year
Minimum:
538.777
jan 1, 1962
Maximum:
660.965
jan 1, 2016
At the date of observation
Value
Absolute change
Change from previous value
jan 1, 1962
538.777
+538.777
0.0%
jan 1, 1963
540.893
+2.116
0.39%
jan 1, 1964
543.226
+2.333
0.43%
jan 1, 1965
545.458
+2.233
0.41%
jan 1, 1966
547.379
+1.921
0.35%
jan 1, 1967
548.937
+1.558
0.28%
jan 1, 1968
550.279
+1.342
0.24%
jan 1, 1969
551.626
+1.347
0.24%
jan 1, 1970
553.281
+1.656
0.3%
jan 1, 1971
555.458
+2.177
0.39%
jan 1, 1972
558.228
+2.77
0.5%
jan 1, 1973
561.491
+3.263
0.58%
jan 1, 1974
565.07
+3.579
0.64%
jan 1, 1975
568.695
+3.626
0.64%
jan 1, 1976
572.17
+3.474
0.61%
jan 1, 1977
575.451
+3.281
0.57%
jan 1, 1978
578.57
+3.119
0.54%
jan 1, 1979
581.477
+2.907
0.5%
jan 1, 1980
584.13
+2.653
0.46%
jan 1, 1981
586.505
+2.374
0.41%
jan 1, 1982
588.558
+2.053
0.35%
jan 1, 1983
590.316
+1.758
0.3%
jan 1, 1984
591.895
+1.579
0.27%
jan 1, 1985
593.477
+1.581
0.27%
jan 1, 1986
595.184
+1.707
0.29%
jan 1, 1987
597.065
+1.881
0.32%
jan 1, 1988
599.091
+2.026
0.34%
jan 1, 1989
601.219
+2.128
0.36%
jan 1, 1990
603.381
+2.163
0.36%
jan 1, 1991
605.521
+2.14
0.35%
jan 1, 1992
607.63
+2.109
0.35%
jan 1, 1993
609.73
+2.1
0.35%
jan 1, 1994
611.84
+2.109
0.35%
jan 1, 1995
613.988
+2.149
0.35%
jan 1, 1996
616.191
+2.202
0.36%
jan 1, 1997
618.465
+2.274
0.37%
jan 1, 1998
620.8
+2.335
0.38%
jan 1, 1999
623.137
+2.337
0.38%
jan 1, 2000
625.395
+2.258
0.36%
jan 1, 2001
627.53
+2.135
0.34%
jan 1, 2002
629.502
+1.972
0.31%
jan 1, 2003
631.347
+1.844
0.29%
jan 1, 2004
633.165
+1.819
0.29%
jan 1, 2005
635.095
+1.93
0.3%
jan 1, 2006
637.24
+2.144
0.34%
jan 1, 2007
639.628
+2.388
0.37%
jan 1, 2008
642.219
+2.591
0.41%
jan 1, 2009
644.919
+2.7
0.42%
jan 1, 2010
647.595
+2.677
0.42%
jan 1, 2011
650.153
+2.558
0.4%
jan 1, 2012
652.563
+2.409
0.37%
jan 1, 2013
654.837
+2.274
0.35%
jan 1, 2014
656.984
+2.147
0.33%
jan 1, 2015
659.023
+2.04
0.31%
jan 1, 2016
660.965
+1.942
0.29%
Ranking of countries by current statistics by years


Comments: