29
/
en
AIzaSyAYiBZKx7MnpbEhh9jyipgxe19OcubqV5w
April 1, 2024
271649
Tuvalu
TUV
true
2
1
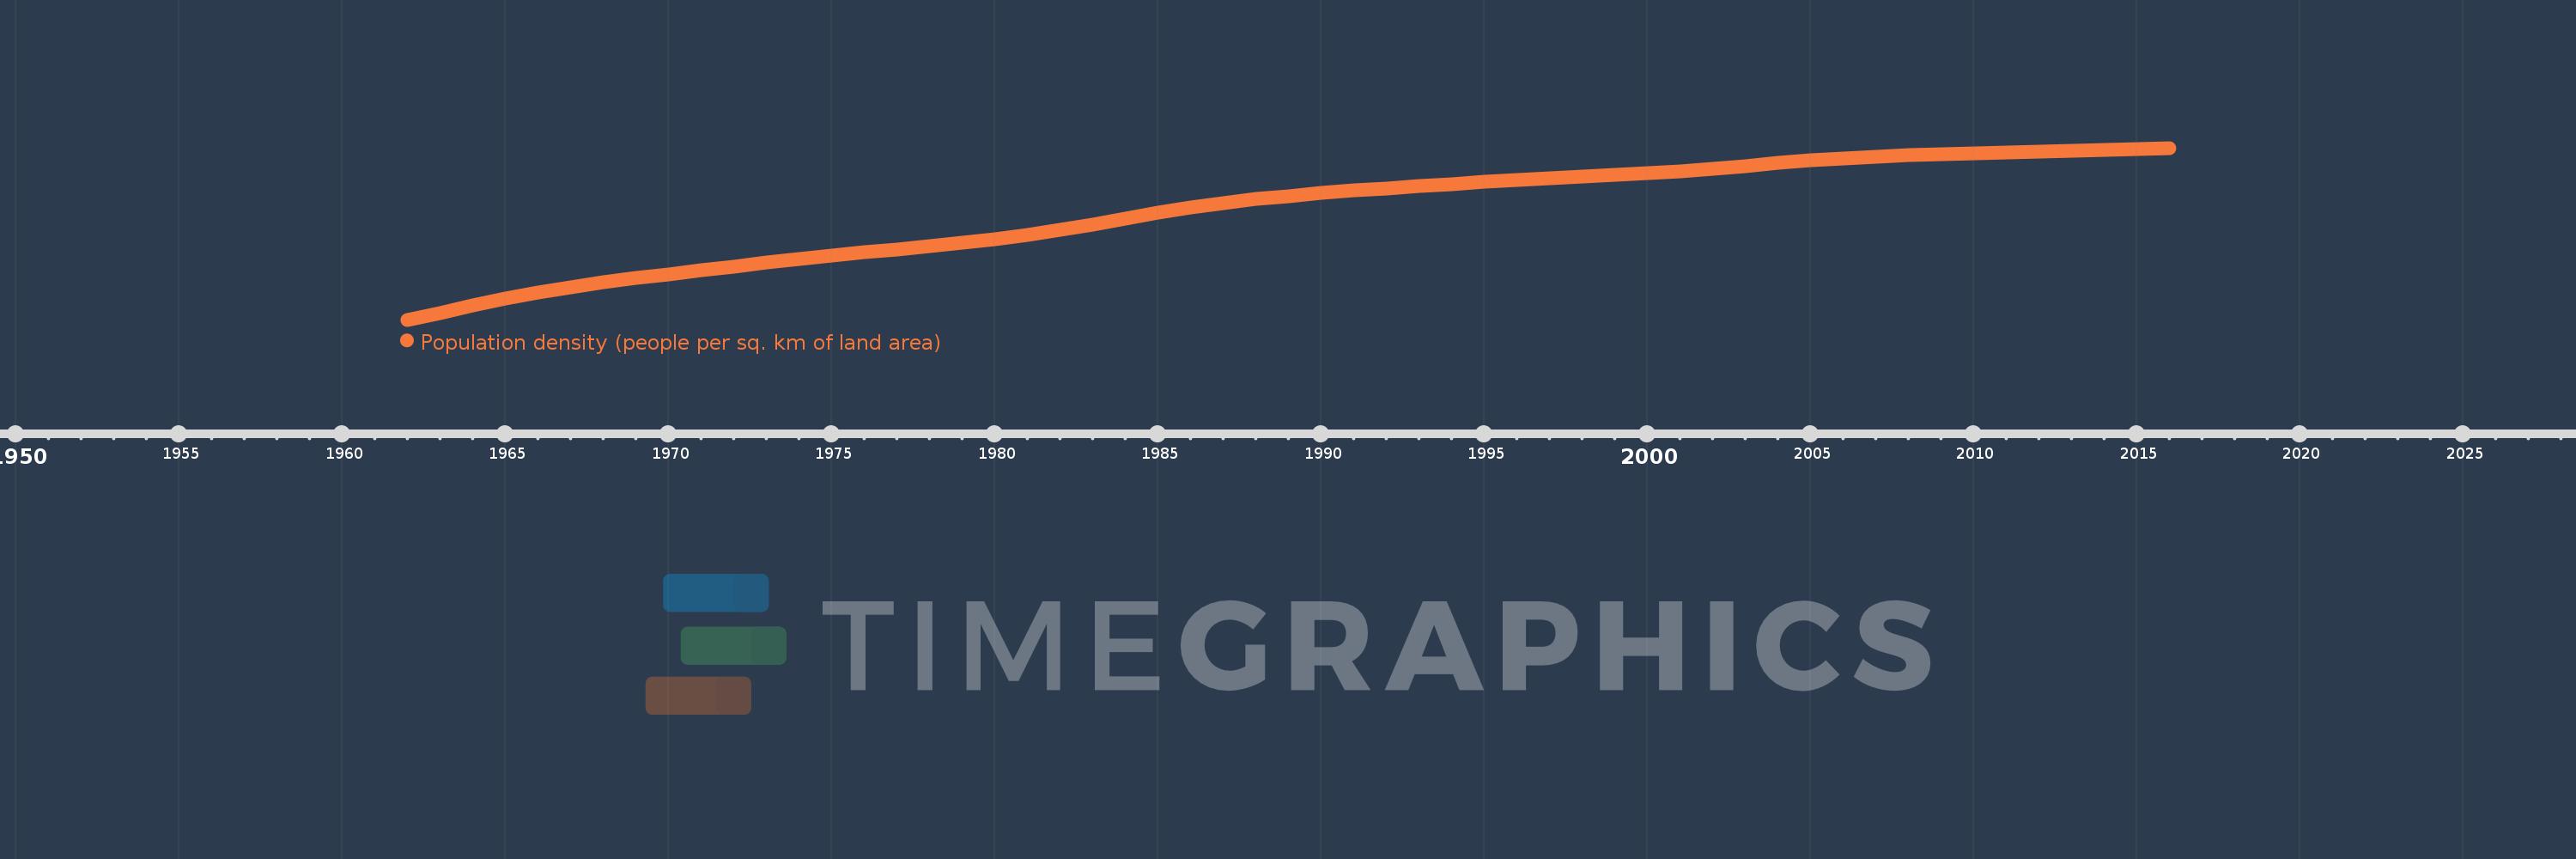
Population density (people per sq. km of land area)
2016,2015,2014,2013,2012,2011,2010,2009,2008,2007,2006,2005,2004,2003,2002,2001,2000,1999,1998,1997,1996,1995,1994,1993,1992,1991,1990,1989,1988,1987,1986,1985,1984,1983,1982,1981,1980,1979,1978,1977,1976,1975,1974,1973,1972,1971,1970,1969,1968,1967,1966,1965,1964,1963,1962
This statistics in other country:
AfghanistanAlbaniaAlgeriaAmerican SamoaAndorraAngolaAntigua and BarbudaArab WorldArgentinaArmeniaArubaAustraliaAustriaAzerbaijanBahamas, TheBahrainBangladeshBarbadosBelarusBelgiumBelizeBeninBermudaBhutanBoliviaBosnia and HerzegovinaBotswanaBrazilBritish Virgin IslandsBrunei DarussalamBulgariaBurkina FasoBurundiCabo VerdeCambodiaCameroonCanadaCaribbean small statesCayman IslandsCentral African RepublicCentral Europe and the BalticsChadChannel IslandsChileChinaColombiaComorosCongo, Dem. Rep.Congo, Rep.Costa RicaCote d'IvoireCroatiaCubaCuracaoCyprusCzech RepublicDenmarkDjiboutiDominicaDominican RepublicEarly-demographic dividendEast Asia & PacificEast Asia & Pacific (excluding high income)East Asia & Pacific (IDA & IBRD countries)EcuadorEgypt, Arab Rep.El SalvadorEquatorial GuineaEritreaEstoniaEthiopiaEuro areaEurope & Central AsiaEurope & Central Asia (excluding high income)Europe & Central Asia (IDA & IBRD countries)European UnionFaroe IslandsFijiFinlandFragile and conflict affected situationsFranceFrench PolynesiaGabonGambia, TheGeorgiaGermanyGhanaGibraltarGreeceGreenlandGrenadaGuamGuatemalaGuineaGuinea-BissauGuyanaHaitiHeavily indebted poor countries (HIPC)High incomeHondurasHong Kong SAR, ChinaHungaryIBRD onlyIcelandIDA & IBRD totalIDA blendIDA onlyIDA totalIndiaIndonesiaIran, Islamic Rep.IraqIrelandIsle of ManIsraelItalyJamaicaJapanJordanKazakhstanKenyaKiribatiKorea, Dem. People’s Rep.Korea, Rep.KosovoKuwaitKyrgyz RepublicLao PDRLate-demographic dividendLatin America & Caribbean Latin America & Caribbean (excluding high income)Latin America & the Caribbean (IDA & IBRD countries)LatviaLeast developed countries: UN classificationLebanonLesothoLiberiaLibyaLiechtensteinLithuaniaLow & middle incomeLow incomeLower middle incomeLuxembourgMacao SAR, ChinaMacedonia, FYRMadagascarMalawiMalaysiaMaldivesMaliMaltaMarshall IslandsMauritaniaMauritiusMexicoMicronesia, Fed. Sts.Middle East & North AfricaMiddle East & North Africa (excluding high income)Middle East & North Africa (IDA & IBRD countries)Middle incomeMoldovaMonacoMongoliaMontenegroMoroccoMozambiqueMyanmarNamibiaNauruNepalNetherlandsNew CaledoniaNew ZealandNicaraguaNigerNigeriaNorth AmericaNorthern Mariana IslandsNorwayOECD membersOmanOther small statesPacific island small statesPakistanPalauPanamaPapua New GuineaParaguayPeruPhilippinesPolandPortugalPost-demographic dividendPre-demographic dividendPuerto RicoQatarRomaniaRussian FederationRwandaSamoaSan MarinoSao Tome and PrincipeSaudi ArabiaSenegalSerbiaSeychellesSierra LeoneSingaporeSint Maarten (Dutch part)Slovak RepublicSloveniaSmall statesSolomon IslandsSomaliaSouth AfricaSouth AsiaSouth Asia (IDA & IBRD)SpainSri LankaSt. Kitts and NevisSt. LuciaSt. Martin (French part)St. Vincent and the GrenadinesSub-Saharan Africa Sub-Saharan Africa (excluding high income)Sub-Saharan Africa (IDA & IBRD countries)SudanSurinameSwazilandSwedenSwitzerlandSyrian Arab RepublicTajikistanTanzaniaThailandTimor-LesteTogoTongaTrinidad and TobagoTunisiaTurkeyTurkmenistanTurks and Caicos IslandsTuvaluUgandaUkraineUnited Arab EmiratesUnited KingdomUnited StatesUpper middle incomeUruguayUzbekistanVanuatuVenezuela, RBVietnamVirgin Islands (U.S.)West Bank and GazaWorldYemen, Rep.ZambiaZimbabwe Timeline:
This timeline shows a graph from 1962 to 2016 of Tuvalu. No data until 1961. Number of actual observations by date: 55.
Source name:
World Development Indicators
Source organization:
Food and Agriculture Organization and World Bank population estimates.
Categories, topics:
Urban Development
Last updated:
apr 23, 2017
Indicators value changes by year
Minimum:
208.067
jan 1, 1962
Maximum:
330.533
jan 1, 2016
At the date of observation
Value
Absolute change
Change from previous value
jan 1, 1962
208.067
+208.067
0.0%
jan 1, 1963
213.033
+4.967
2.39%
jan 1, 1964
218.067
+5.033
2.36%
jan 1, 1965
222.9
+4.833
2.22%
jan 1, 1966
227.3
+4.4
1.97%
jan 1, 1967
231.167
+3.867
1.7%
jan 1, 1968
234.567
+3.4
1.47%
jan 1, 1969
237.6
+3.033
1.29%
jan 1, 1970
240.433
+2.833
1.19%
jan 1, 1971
243.2
+2.767
1.15%
jan 1, 1972
245.967
+2.767
1.14%
jan 1, 1973
248.633
+2.667
1.08%
jan 1, 1974
251.267
+2.633
1.06%
jan 1, 1975
253.767
+2.5
0.99%
jan 1, 1976
256.167
+2.4
0.95%
jan 1, 1977
258.4
+2.233
0.87%
jan 1, 1978
260.533
+2.133
0.83%
jan 1, 1979
262.767
+2.233
0.86%
jan 1, 1980
265.3
+2.533
0.96%
jan 1, 1981
268.367
+3.067
1.16%
jan 1, 1982
272.0
+3.633
1.35%
jan 1, 1983
276.133
+4.133
1.52%
jan 1, 1984
280.433
+4.3
1.56%
jan 1, 1985
284.567
+4.133
1.47%
jan 1, 1986
288.267
+3.7
1.3%
jan 1, 1987
291.367
+3.1
1.08%
jan 1, 1988
294.033
+2.667
0.92%
jan 1, 1989
296.3
+2.267
0.77%
jan 1, 1990
298.3
+2.0
0.67%
jan 1, 1991
300.133
+1.833
0.61%
jan 1, 1992
301.867
+1.733
0.58%
jan 1, 1993
303.433
+1.567
0.52%
jan 1, 1994
304.933
+1.5
0.49%
jan 1, 1995
306.267
+1.333
0.44%
jan 1, 1996
307.567
+1.3
0.42%
jan 1, 1997
308.8
+1.233
0.4%
jan 1, 1998
309.933
+1.133
0.37%
jan 1, 1999
311.133
+1.2
0.39%
jan 1, 2000
312.467
+1.333
0.43%
jan 1, 2001
313.967
+1.5
0.48%
jan 1, 2002
315.7
+1.733
0.55%
jan 1, 2003
317.667
+1.967
0.62%
jan 1, 2004
319.667
+2.0
0.63%
jan 1, 2005
321.533
+1.867
0.58%
jan 1, 2006
323.133
+1.6
0.5%
jan 1, 2007
324.4
+1.267
0.39%
jan 1, 2008
325.467
+1.067
0.33%
jan 1, 2009
326.267
+0.8
0.25%
jan 1, 2010
326.933
+0.667
0.2%
jan 1, 2011
327.567
+0.633
0.19%
jan 1, 2012
328.133
+0.567
0.17%
jan 1, 2013
328.667
+0.533
0.16%
jan 1, 2014
329.2
+0.533
0.16%
jan 1, 2015
329.767
+0.567
0.17%
jan 1, 2016
330.533
+0.767
0.23%
Ranking of countries by current statistics by years


Comments: