29
/
en
AIzaSyAYiBZKx7MnpbEhh9jyipgxe19OcubqV5w
April 1, 2024
265072
Togo
TGO
true
2
1
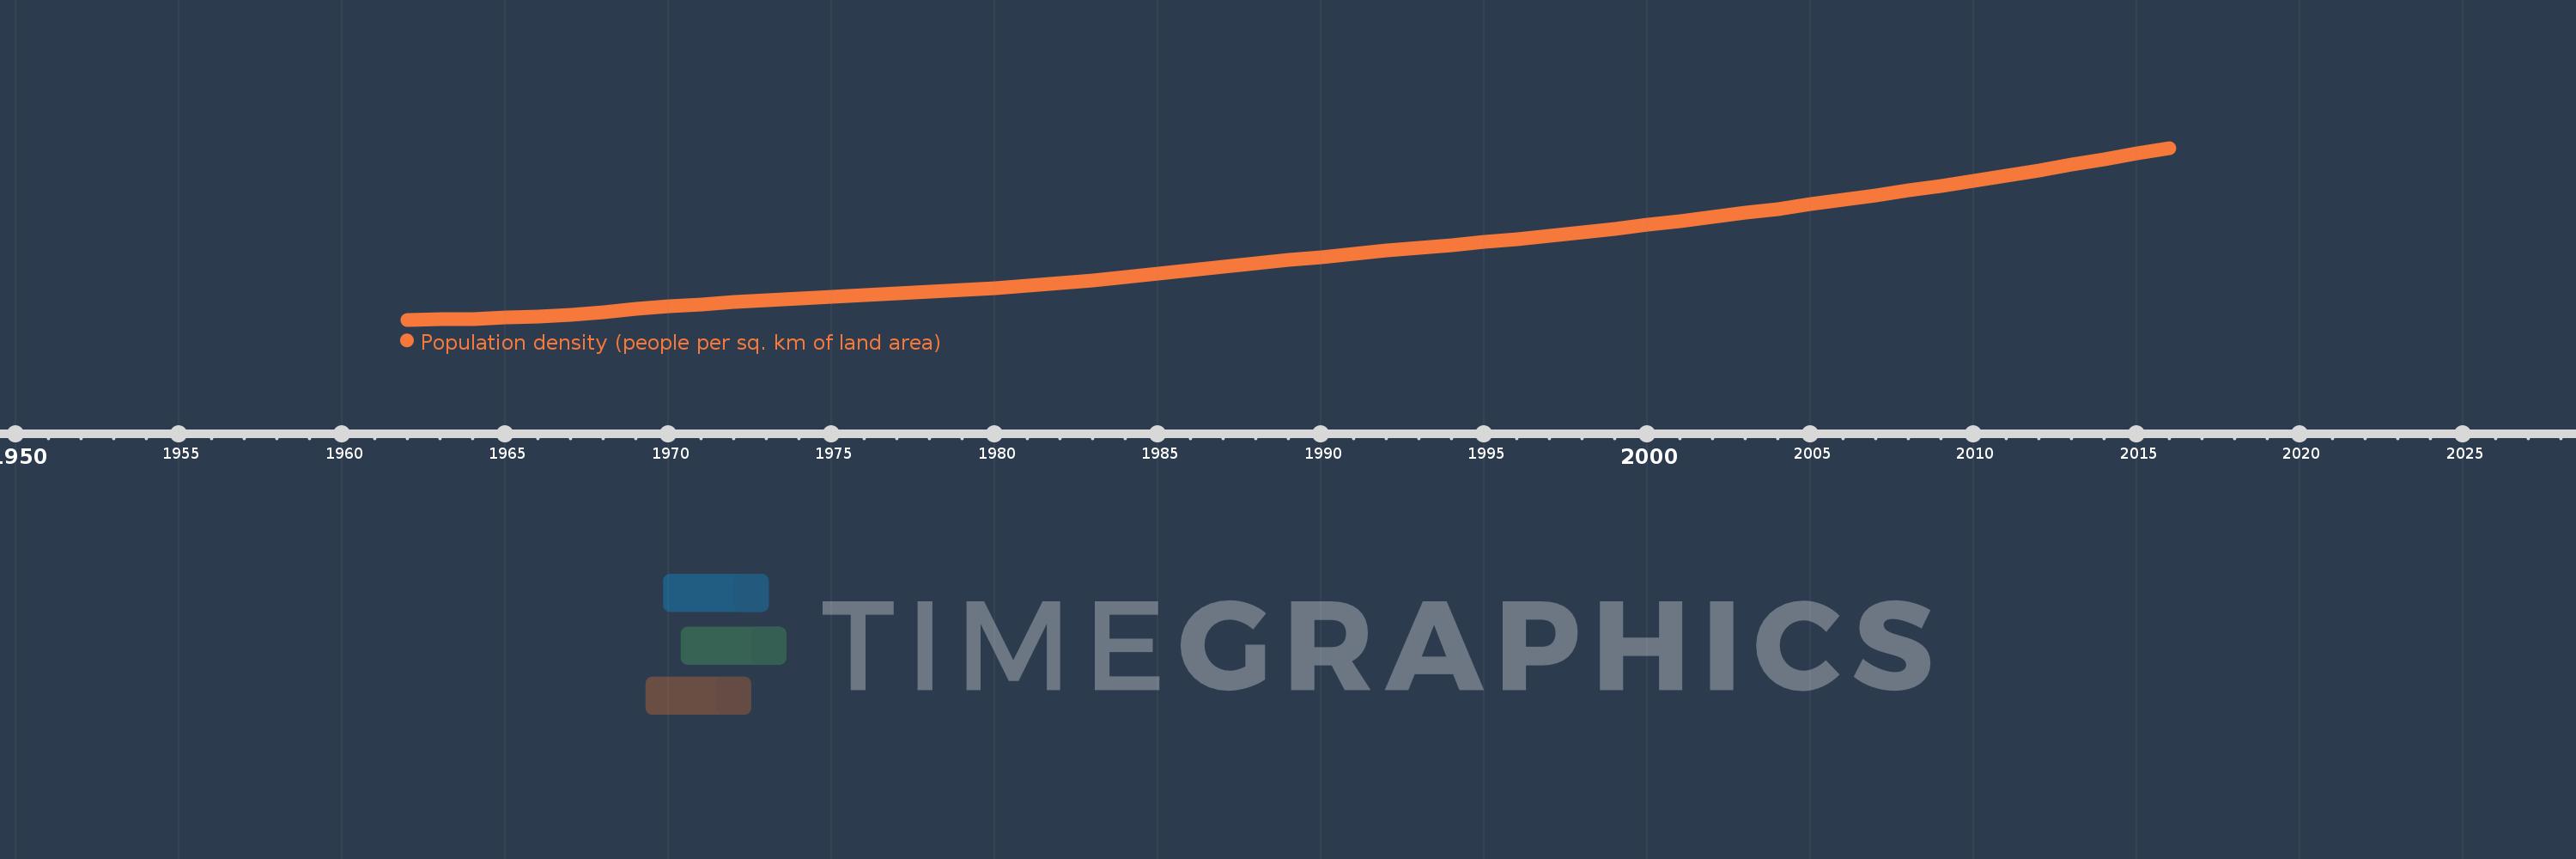
Population density (people per sq. km of land area)
2016,2015,2014,2013,2012,2011,2010,2009,2008,2007,2006,2005,2004,2003,2002,2001,2000,1999,1998,1997,1996,1995,1994,1993,1992,1991,1990,1989,1988,1987,1986,1985,1984,1983,1982,1981,1980,1979,1978,1977,1976,1975,1974,1973,1972,1971,1970,1969,1968,1967,1966,1965,1964,1963,1962
This statistics in other country:
AfghanistanAlbaniaAlgeriaAmerican SamoaAndorraAngolaAntigua and BarbudaArab WorldArgentinaArmeniaArubaAustraliaAustriaAzerbaijanBahamas, TheBahrainBangladeshBarbadosBelarusBelgiumBelizeBeninBermudaBhutanBoliviaBosnia and HerzegovinaBotswanaBrazilBritish Virgin IslandsBrunei DarussalamBulgariaBurkina FasoBurundiCabo VerdeCambodiaCameroonCanadaCaribbean small statesCayman IslandsCentral African RepublicCentral Europe and the BalticsChadChannel IslandsChileChinaColombiaComorosCongo, Dem. Rep.Congo, Rep.Costa RicaCote d'IvoireCroatiaCubaCuracaoCyprusCzech RepublicDenmarkDjiboutiDominicaDominican RepublicEarly-demographic dividendEast Asia & PacificEast Asia & Pacific (excluding high income)East Asia & Pacific (IDA & IBRD countries)EcuadorEgypt, Arab Rep.El SalvadorEquatorial GuineaEritreaEstoniaEthiopiaEuro areaEurope & Central AsiaEurope & Central Asia (excluding high income)Europe & Central Asia (IDA & IBRD countries)European UnionFaroe IslandsFijiFinlandFragile and conflict affected situationsFranceFrench PolynesiaGabonGambia, TheGeorgiaGermanyGhanaGibraltarGreeceGreenlandGrenadaGuamGuatemalaGuineaGuinea-BissauGuyanaHaitiHeavily indebted poor countries (HIPC)High incomeHondurasHong Kong SAR, ChinaHungaryIBRD onlyIcelandIDA & IBRD totalIDA blendIDA onlyIDA totalIndiaIndonesiaIran, Islamic Rep.IraqIrelandIsle of ManIsraelItalyJamaicaJapanJordanKazakhstanKenyaKiribatiKorea, Dem. People’s Rep.Korea, Rep.KosovoKuwaitKyrgyz RepublicLao PDRLate-demographic dividendLatin America & Caribbean Latin America & Caribbean (excluding high income)Latin America & the Caribbean (IDA & IBRD countries)LatviaLeast developed countries: UN classificationLebanonLesothoLiberiaLibyaLiechtensteinLithuaniaLow & middle incomeLow incomeLower middle incomeLuxembourgMacao SAR, ChinaMacedonia, FYRMadagascarMalawiMalaysiaMaldivesMaliMaltaMarshall IslandsMauritaniaMauritiusMexicoMicronesia, Fed. Sts.Middle East & North AfricaMiddle East & North Africa (excluding high income)Middle East & North Africa (IDA & IBRD countries)Middle incomeMoldovaMonacoMongoliaMontenegroMoroccoMozambiqueMyanmarNamibiaNauruNepalNetherlandsNew CaledoniaNew ZealandNicaraguaNigerNigeriaNorth AmericaNorthern Mariana IslandsNorwayOECD membersOmanOther small statesPacific island small statesPakistanPalauPanamaPapua New GuineaParaguayPeruPhilippinesPolandPortugalPost-demographic dividendPre-demographic dividendPuerto RicoQatarRomaniaRussian FederationRwandaSamoaSan MarinoSao Tome and PrincipeSaudi ArabiaSenegalSerbiaSeychellesSierra LeoneSingaporeSint Maarten (Dutch part)Slovak RepublicSloveniaSmall statesSolomon IslandsSomaliaSouth AfricaSouth AsiaSouth Asia (IDA & IBRD)SpainSri LankaSt. Kitts and NevisSt. LuciaSt. Martin (French part)St. Vincent and the GrenadinesSub-Saharan Africa Sub-Saharan Africa (excluding high income)Sub-Saharan Africa (IDA & IBRD countries)SudanSurinameSwazilandSwedenSwitzerlandSyrian Arab RepublicTajikistanTanzaniaThailandTimor-LesteTogoTongaTrinidad and TobagoTunisiaTurkeyTurkmenistanTurks and Caicos IslandsTuvaluUgandaUkraineUnited Arab EmiratesUnited KingdomUnited StatesUpper middle incomeUruguayUzbekistanVanuatuVenezuela, RBVietnamVirgin Islands (U.S.)West Bank and GazaWorldYemen, Rep.ZambiaZimbabwe Timeline:
This timeline shows a graph from 1962 to 2016 of Togo. No data until 1961. Number of actual observations by date: 55.
Source name:
World Development Indicators
Source organization:
Food and Agriculture Organization and World Bank population estimates.
Categories, topics:
Urban Development
Last updated:
apr 23, 2017
Indicators value changes by year
Minimum:
29.372
jan 1, 1962
At the date of observation
Value
Absolute change
Change from previous value
jan 1, 1962
29.372
+29.372
0.0%
jan 1, 1963
29.652
+0.28
0.95%
jan 1, 1964
30.001
+0.349
1.18%
jan 1, 1965
30.558
+0.557
1.86%
jan 1, 1966
31.414
+0.856
2.8%
jan 1, 1967
32.617
+1.202
3.83%
jan 1, 1968
34.114
+1.497
4.59%
jan 1, 1969
35.775
+1.661
4.87%
jan 1, 1970
37.413
+1.639
4.58%
jan 1, 1971
38.895
+1.482
3.96%
jan 1, 1972
40.185
+1.29
3.32%
jan 1, 1973
41.323
+1.138
2.83%
jan 1, 1974
42.349
+1.025
2.48%
jan 1, 1975
43.328
+0.98
2.31%
jan 1, 1976
44.318
+0.99
2.28%
jan 1, 1977
45.311
+0.993
2.24%
jan 1, 1978
46.306
+0.995
2.2%
jan 1, 1979
47.37
+1.065
2.3%
jan 1, 1980
48.591
+1.22
2.58%
jan 1, 1981
50.025
+1.434
2.95%
jan 1, 1982
51.702
+1.677
3.35%
jan 1, 1983
53.597
+1.895
3.67%
jan 1, 1984
55.642
+2.045
3.82%
jan 1, 1985
57.738
+2.096
3.77%
jan 1, 1986
59.809
+2.071
3.59%
jan 1, 1987
61.839
+2.031
3.4%
jan 1, 1988
63.844
+2.004
3.24%
jan 1, 1989
65.812
+1.968
3.08%
jan 1, 1990
67.739
+1.927
2.93%
jan 1, 1991
69.626
+1.887
2.79%
jan 1, 1992
71.463
+1.837
2.64%
jan 1, 1993
73.255
+1.793
2.51%
jan 1, 1994
75.039
+1.784
2.44%
jan 1, 1995
76.865
+1.826
2.43%
jan 1, 1996
78.77
+1.905
2.48%
jan 1, 1997
80.767
+1.998
2.54%
jan 1, 1998
82.855
+2.087
2.58%
jan 1, 1999
85.031
+2.176
2.63%
jan 1, 2000
87.289
+2.258
2.66%
jan 1, 2001
89.626
+2.336
2.68%
jan 1, 2002
92.043
+2.418
2.7%
jan 1, 2003
94.547
+2.504
2.72%
jan 1, 2004
97.136
+2.589
2.74%
jan 1, 2005
99.808
+2.672
2.75%
jan 1, 2006
102.56
+2.752
2.76%
jan 1, 2007
105.39
+2.831
2.76%
jan 1, 2008
108.3
+2.909
2.76%
jan 1, 2009
111.288
+2.988
2.76%
jan 1, 2010
114.355
+3.067
2.76%
jan 1, 2011
117.5
+3.146
2.75%
jan 1, 2012
120.724
+3.224
2.74%
jan 1, 2013
124.022
+3.298
2.73%
jan 1, 2014
127.39
+3.367
2.71%
jan 1, 2015
130.817
+3.428
2.69%
jan 1, 2016
134.3
+3.483
2.66%
Ranking of countries by current statistics by years


Comments: