29
/
en
AIzaSyAYiBZKx7MnpbEhh9jyipgxe19OcubqV5w
April 1, 2024
155115
India
IND
true
2
1
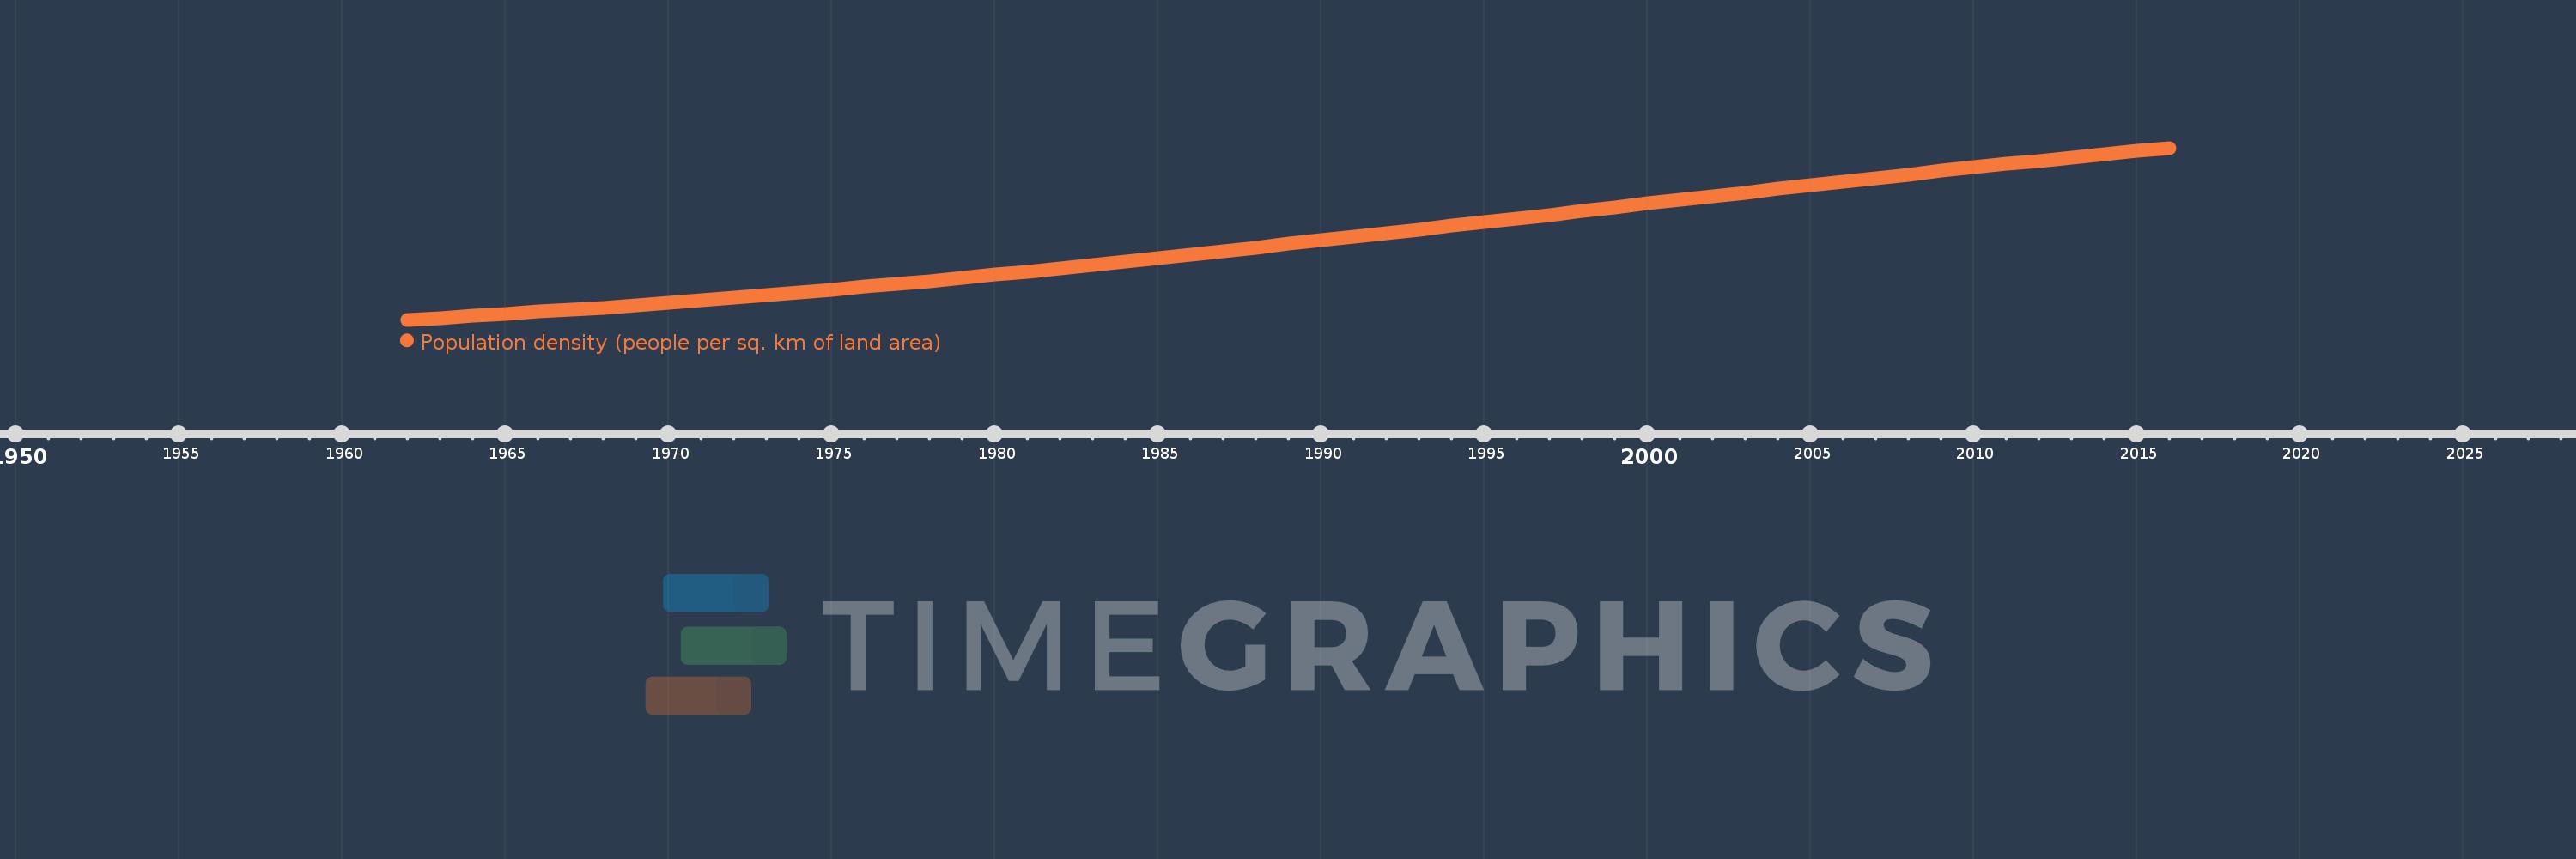
Population density (people per sq. km of land area)
2016,2015,2014,2013,2012,2011,2010,2009,2008,2007,2006,2005,2004,2003,2002,2001,2000,1999,1998,1997,1996,1995,1994,1993,1992,1991,1990,1989,1988,1987,1986,1985,1984,1983,1982,1981,1980,1979,1978,1977,1976,1975,1974,1973,1972,1971,1970,1969,1968,1967,1966,1965,1964,1963,1962
This statistics in other country:
AfghanistanAlbaniaAlgeriaAmerican SamoaAndorraAngolaAntigua and BarbudaArab WorldArgentinaArmeniaArubaAustraliaAustriaAzerbaijanBahamas, TheBahrainBangladeshBarbadosBelarusBelgiumBelizeBeninBermudaBhutanBoliviaBosnia and HerzegovinaBotswanaBrazilBritish Virgin IslandsBrunei DarussalamBulgariaBurkina FasoBurundiCabo VerdeCambodiaCameroonCanadaCaribbean small statesCayman IslandsCentral African RepublicCentral Europe and the BalticsChadChannel IslandsChileChinaColombiaComorosCongo, Dem. Rep.Congo, Rep.Costa RicaCote d'IvoireCroatiaCubaCuracaoCyprusCzech RepublicDenmarkDjiboutiDominicaDominican RepublicEarly-demographic dividendEast Asia & PacificEast Asia & Pacific (excluding high income)East Asia & Pacific (IDA & IBRD countries)EcuadorEgypt, Arab Rep.El SalvadorEquatorial GuineaEritreaEstoniaEthiopiaEuro areaEurope & Central AsiaEurope & Central Asia (excluding high income)Europe & Central Asia (IDA & IBRD countries)European UnionFaroe IslandsFijiFinlandFragile and conflict affected situationsFranceFrench PolynesiaGabonGambia, TheGeorgiaGermanyGhanaGibraltarGreeceGreenlandGrenadaGuamGuatemalaGuineaGuinea-BissauGuyanaHaitiHeavily indebted poor countries (HIPC)High incomeHondurasHong Kong SAR, ChinaHungaryIBRD onlyIcelandIDA & IBRD totalIDA blendIDA onlyIDA totalIndiaIndonesiaIran, Islamic Rep.IraqIrelandIsle of ManIsraelItalyJamaicaJapanJordanKazakhstanKenyaKiribatiKorea, Dem. People’s Rep.Korea, Rep.KosovoKuwaitKyrgyz RepublicLao PDRLate-demographic dividendLatin America & Caribbean Latin America & Caribbean (excluding high income)Latin America & the Caribbean (IDA & IBRD countries)LatviaLeast developed countries: UN classificationLebanonLesothoLiberiaLibyaLiechtensteinLithuaniaLow & middle incomeLow incomeLower middle incomeLuxembourgMacao SAR, ChinaMacedonia, FYRMadagascarMalawiMalaysiaMaldivesMaliMaltaMarshall IslandsMauritaniaMauritiusMexicoMicronesia, Fed. Sts.Middle East & North AfricaMiddle East & North Africa (excluding high income)Middle East & North Africa (IDA & IBRD countries)Middle incomeMoldovaMonacoMongoliaMontenegroMoroccoMozambiqueMyanmarNamibiaNauruNepalNetherlandsNew CaledoniaNew ZealandNicaraguaNigerNigeriaNorth AmericaNorthern Mariana IslandsNorwayOECD membersOmanOther small statesPacific island small statesPakistanPalauPanamaPapua New GuineaParaguayPeruPhilippinesPolandPortugalPost-demographic dividendPre-demographic dividendPuerto RicoQatarRomaniaRussian FederationRwandaSamoaSan MarinoSao Tome and PrincipeSaudi ArabiaSenegalSerbiaSeychellesSierra LeoneSingaporeSint Maarten (Dutch part)Slovak RepublicSloveniaSmall statesSolomon IslandsSomaliaSouth AfricaSouth AsiaSouth Asia (IDA & IBRD)SpainSri LankaSt. Kitts and NevisSt. LuciaSt. Martin (French part)St. Vincent and the GrenadinesSub-Saharan Africa Sub-Saharan Africa (excluding high income)Sub-Saharan Africa (IDA & IBRD countries)SudanSurinameSwazilandSwedenSwitzerlandSyrian Arab RepublicTajikistanTanzaniaThailandTimor-LesteTogoTongaTrinidad and TobagoTunisiaTurkeyTurkmenistanTurks and Caicos IslandsTuvaluUgandaUkraineUnited Arab EmiratesUnited KingdomUnited StatesUpper middle incomeUruguayUzbekistanVanuatuVenezuela, RBVietnamVirgin Islands (U.S.)West Bank and GazaWorldYemen, Rep.ZambiaZimbabwe Timeline:
This timeline shows a graph from 1962 to 2016 of India. No data until 1961. Number of actual observations by date: 55.
Source name:
World Development Indicators
Source organization:
Food and Agriculture Organization and World Bank population estimates.
Categories, topics:
Urban Development
Last updated:
apr 23, 2017
Indicators value changes by year
Minimum:
154.276
jan 1, 1962
Maximum:
440.958
jan 1, 2016
At the date of observation
Value
Absolute change
Change from previous value
jan 1, 1962
154.276
+154.276
0.0%
jan 1, 1963
157.425
+3.149
2.04%
jan 1, 1964
160.679
+3.254
2.07%
jan 1, 1965
164.029
+3.35
2.08%
jan 1, 1966
167.47
+3.441
2.1%
jan 1, 1967
170.996
+3.526
2.11%
jan 1, 1968
174.614
+3.619
2.12%
jan 1, 1969
178.352
+3.738
2.14%
jan 1, 1970
182.244
+3.891
2.18%
jan 1, 1971
186.313
+4.069
2.23%
jan 1, 1972
190.572
+4.259
2.29%
jan 1, 1973
195.01
+4.438
2.33%
jan 1, 1974
199.601
+4.591
2.35%
jan 1, 1975
204.308
+4.707
2.36%
jan 1, 1976
209.103
+4.795
2.35%
jan 1, 1977
213.973
+4.87
2.33%
jan 1, 1978
218.926
+4.953
2.31%
jan 1, 1979
223.98
+5.055
2.31%
jan 1, 1980
229.168
+5.187
2.32%
jan 1, 1981
234.506
+5.338
2.33%
jan 1, 1982
239.999
+5.493
2.34%
jan 1, 1983
245.63
+5.631
2.35%
jan 1, 1984
251.371
+5.742
2.34%
jan 1, 1985
257.186
+5.815
2.31%
jan 1, 1986
263.046
+5.859
2.28%
jan 1, 1987
268.939
+5.893
2.24%
jan 1, 1988
274.867
+5.928
2.2%
jan 1, 1989
280.824
+5.957
2.17%
jan 1, 1990
286.808
+5.984
2.13%
jan 1, 1991
292.817
+6.009
2.1%
jan 1, 1992
298.842
+6.025
2.06%
jan 1, 1993
304.878
+6.036
2.02%
jan 1, 1994
310.937
+6.059
1.99%
jan 1, 1995
317.035
+6.097
1.96%
jan 1, 1996
323.18
+6.145
1.94%
jan 1, 1997
329.374
+6.194
1.92%
jan 1, 1998
335.605
+6.231
1.89%
jan 1, 1999
341.856
+6.251
1.86%
jan 1, 2000
348.103
+6.247
1.83%
jan 1, 2001
354.327
+6.224
1.79%
jan 1, 2002
360.518
+6.191
1.75%
jan 1, 2003
366.673
+6.155
1.71%
jan 1, 2004
372.788
+6.115
1.67%
jan 1, 2005
378.859
+6.071
1.63%
jan 1, 2006
384.882
+6.023
1.59%
jan 1, 2007
390.856
+5.974
1.55%
jan 1, 2008
396.774
+5.919
1.51%
jan 1, 2009
402.621
+5.847
1.47%
jan 1, 2010
408.377
+5.755
1.43%
jan 1, 2011
414.028
+5.651
1.38%
jan 1, 2012
419.565
+5.537
1.34%
jan 1, 2013
424.995
+5.43
1.29%
jan 1, 2014
430.345
+5.351
1.26%
jan 1, 2015
435.657
+5.312
1.23%
jan 1, 2016
440.958
+5.3
1.22%
Ranking of countries by current statistics by years


Comments: