29
/
en
AIzaSyAYiBZKx7MnpbEhh9jyipgxe19OcubqV5w
April 1, 2024
281482
Venezuela, RB
VEN
true
2
1
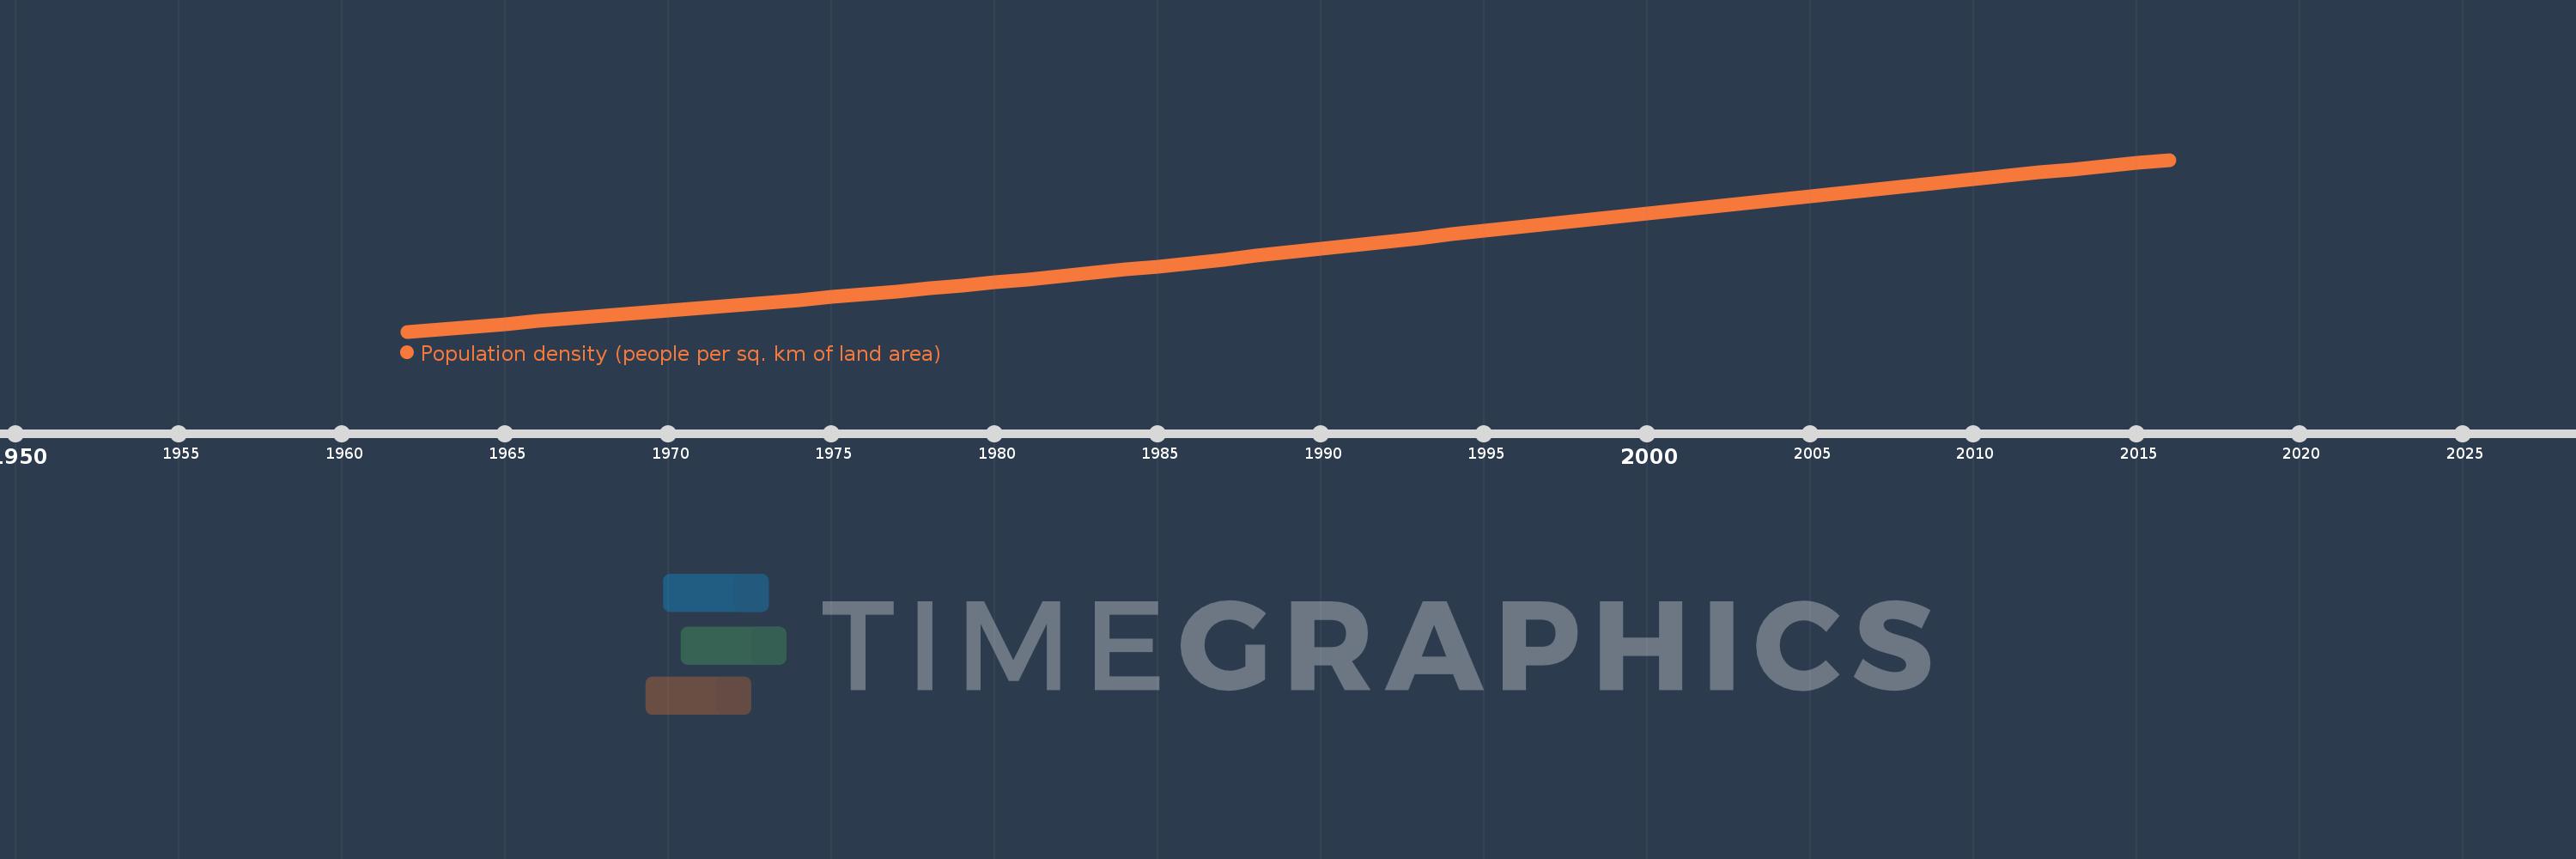
Population density (people per sq. km of land area)
2016,2015,2014,2013,2012,2011,2010,2009,2008,2007,2006,2005,2004,2003,2002,2001,2000,1999,1998,1997,1996,1995,1994,1993,1992,1991,1990,1989,1988,1987,1986,1985,1984,1983,1982,1981,1980,1979,1978,1977,1976,1975,1974,1973,1972,1971,1970,1969,1968,1967,1966,1965,1964,1963,1962
This statistics in other country:
AfghanistanAlbaniaAlgeriaAmerican SamoaAndorraAngolaAntigua and BarbudaArab WorldArgentinaArmeniaArubaAustraliaAustriaAzerbaijanBahamas, TheBahrainBangladeshBarbadosBelarusBelgiumBelizeBeninBermudaBhutanBoliviaBosnia and HerzegovinaBotswanaBrazilBritish Virgin IslandsBrunei DarussalamBulgariaBurkina FasoBurundiCabo VerdeCambodiaCameroonCanadaCaribbean small statesCayman IslandsCentral African RepublicCentral Europe and the BalticsChadChannel IslandsChileChinaColombiaComorosCongo, Dem. Rep.Congo, Rep.Costa RicaCote d'IvoireCroatiaCubaCuracaoCyprusCzech RepublicDenmarkDjiboutiDominicaDominican RepublicEarly-demographic dividendEast Asia & PacificEast Asia & Pacific (excluding high income)East Asia & Pacific (IDA & IBRD countries)EcuadorEgypt, Arab Rep.El SalvadorEquatorial GuineaEritreaEstoniaEthiopiaEuro areaEurope & Central AsiaEurope & Central Asia (excluding high income)Europe & Central Asia (IDA & IBRD countries)European UnionFaroe IslandsFijiFinlandFragile and conflict affected situationsFranceFrench PolynesiaGabonGambia, TheGeorgiaGermanyGhanaGibraltarGreeceGreenlandGrenadaGuamGuatemalaGuineaGuinea-BissauGuyanaHaitiHeavily indebted poor countries (HIPC)High incomeHondurasHong Kong SAR, ChinaHungaryIBRD onlyIcelandIDA & IBRD totalIDA blendIDA onlyIDA totalIndiaIndonesiaIran, Islamic Rep.IraqIrelandIsle of ManIsraelItalyJamaicaJapanJordanKazakhstanKenyaKiribatiKorea, Dem. People’s Rep.Korea, Rep.KosovoKuwaitKyrgyz RepublicLao PDRLate-demographic dividendLatin America & Caribbean Latin America & Caribbean (excluding high income)Latin America & the Caribbean (IDA & IBRD countries)LatviaLeast developed countries: UN classificationLebanonLesothoLiberiaLibyaLiechtensteinLithuaniaLow & middle incomeLow incomeLower middle incomeLuxembourgMacao SAR, ChinaMacedonia, FYRMadagascarMalawiMalaysiaMaldivesMaliMaltaMarshall IslandsMauritaniaMauritiusMexicoMicronesia, Fed. Sts.Middle East & North AfricaMiddle East & North Africa (excluding high income)Middle East & North Africa (IDA & IBRD countries)Middle incomeMoldovaMonacoMongoliaMontenegroMoroccoMozambiqueMyanmarNamibiaNauruNepalNetherlandsNew CaledoniaNew ZealandNicaraguaNigerNigeriaNorth AmericaNorthern Mariana IslandsNorwayOECD membersOmanOther small statesPacific island small statesPakistanPalauPanamaPapua New GuineaParaguayPeruPhilippinesPolandPortugalPost-demographic dividendPre-demographic dividendPuerto RicoQatarRomaniaRussian FederationRwandaSamoaSan MarinoSao Tome and PrincipeSaudi ArabiaSenegalSerbiaSeychellesSierra LeoneSingaporeSint Maarten (Dutch part)Slovak RepublicSloveniaSmall statesSolomon IslandsSomaliaSouth AfricaSouth AsiaSouth Asia (IDA & IBRD)SpainSri LankaSt. Kitts and NevisSt. LuciaSt. Martin (French part)St. Vincent and the GrenadinesSub-Saharan Africa Sub-Saharan Africa (excluding high income)Sub-Saharan Africa (IDA & IBRD countries)SudanSurinameSwazilandSwedenSwitzerlandSyrian Arab RepublicTajikistanTanzaniaThailandTimor-LesteTogoTongaTrinidad and TobagoTunisiaTurkeyTurkmenistanTurks and Caicos IslandsTuvaluUgandaUkraineUnited Arab EmiratesUnited KingdomUnited StatesUpper middle incomeUruguayUzbekistanVanuatuVenezuela, RBVietnamVirgin Islands (U.S.)West Bank and GazaWorldYemen, Rep.ZambiaZimbabwe Timeline:
This timeline shows a graph from 1962 to 2016 of Venezuela, RB. No data until 1961. Number of actual observations by date: 55.
Source name:
World Development Indicators
Source organization:
Food and Agriculture Organization and World Bank population estimates.
Categories, topics:
Urban Development
Last updated:
apr 23, 2017
Indicators value changes by year
Maximum:
35.268
jan 1, 2016
At the date of observation
Value
Absolute change
Change from previous value
jan 1, 1962
9.593
+9.593
0.0%
jan 1, 1963
9.966
+0.373
3.89%
jan 1, 1964
10.351
+0.385
3.86%
jan 1, 1965
10.743
+0.392
3.79%
jan 1, 1966
11.138
+0.395
3.68%
jan 1, 1967
11.536
+0.397
3.57%
jan 1, 1968
11.936
+0.4
3.47%
jan 1, 1969
12.337
+0.401
3.36%
jan 1, 1970
12.738
+0.401
3.25%
jan 1, 1971
13.137
+0.399
3.14%
jan 1, 1972
13.534
+0.397
3.02%
jan 1, 1973
13.929
+0.395
2.92%
jan 1, 1974
14.327
+0.397
2.85%
jan 1, 1975
14.732
+0.405
2.83%
jan 1, 1976
15.148
+0.416
2.82%
jan 1, 1977
15.576
+0.429
2.83%
jan 1, 1978
16.017
+0.441
2.83%
jan 1, 1979
16.468
+0.451
2.82%
jan 1, 1980
16.928
+0.46
2.79%
jan 1, 1981
17.396
+0.467
2.76%
jan 1, 1982
17.87
+0.474
2.72%
jan 1, 1983
18.35
+0.481
2.69%
jan 1, 1984
18.839
+0.489
2.67%
jan 1, 1985
19.339
+0.499
2.65%
jan 1, 1986
19.849
+0.51
2.64%
jan 1, 1987
20.371
+0.522
2.63%
jan 1, 1988
20.903
+0.532
2.61%
jan 1, 1989
21.441
+0.538
2.57%
jan 1, 1990
21.981
+0.539
2.52%
jan 1, 1991
22.518
+0.537
2.44%
jan 1, 1992
23.051
+0.533
2.37%
jan 1, 1993
23.581
+0.53
2.3%
jan 1, 1994
24.107
+0.527
2.23%
jan 1, 1995
24.632
+0.525
2.18%
jan 1, 1996
25.156
+0.524
2.13%
jan 1, 1997
25.678
+0.522
2.08%
jan 1, 1998
26.198
+0.52
2.03%
jan 1, 1999
26.717
+0.519
1.98%
jan 1, 2000
27.236
+0.519
1.94%
jan 1, 2001
27.755
+0.519
1.91%
jan 1, 2002
28.275
+0.52
1.87%
jan 1, 2003
28.796
+0.52
1.84%
jan 1, 2004
29.315
+0.52
1.8%
jan 1, 2005
29.833
+0.518
1.77%
jan 1, 2006
30.349
+0.515
1.73%
jan 1, 2007
30.861
+0.513
1.69%
jan 1, 2008
31.371
+0.51
1.65%
jan 1, 2009
31.877
+0.506
1.61%
jan 1, 2010
32.378
+0.501
1.57%
jan 1, 2011
32.873
+0.496
1.53%
jan 1, 2012
33.363
+0.49
1.49%
jan 1, 2013
33.846
+0.484
1.45%
jan 1, 2014
34.325
+0.478
1.41%
jan 1, 2015
34.798
+0.474
1.38%
jan 1, 2016
35.268
+0.47
1.35%
Ranking of countries by current statistics by years


Comments: