29
/
en
AIzaSyAYiBZKx7MnpbEhh9jyipgxe19OcubqV5w
April 1, 2024
40248
IDA total
IDA
false
2
1
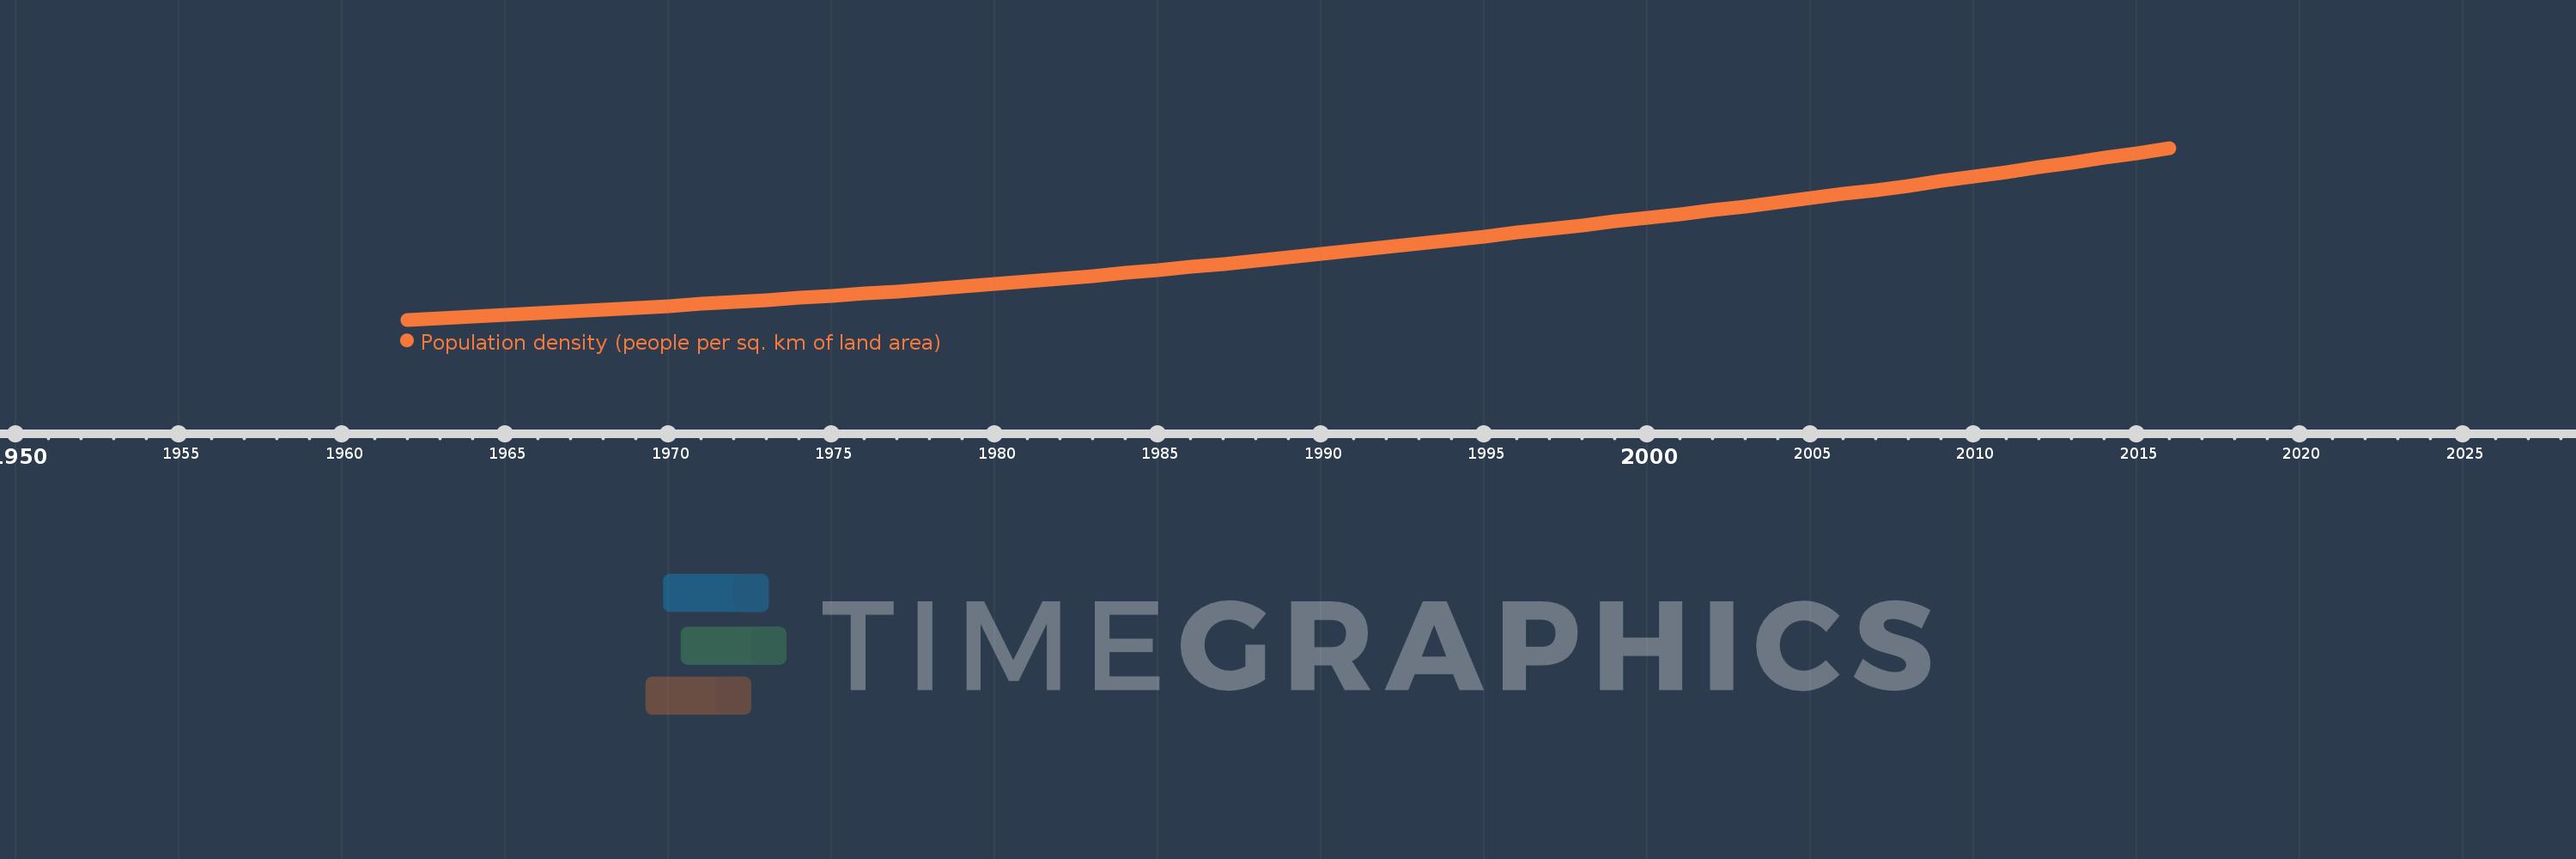
Population density (people per sq. km of land area)
2016,2015,2014,2013,2012,2011,2010,2009,2008,2007,2006,2005,2004,2003,2002,2001,2000,1999,1998,1997,1996,1995,1994,1993,1992,1991,1990,1989,1988,1987,1986,1985,1984,1983,1982,1981,1980,1979,1978,1977,1976,1975,1974,1973,1972,1971,1970,1969,1968,1967,1966,1965,1964,1963,1962
This statistics in other country:
AfghanistanAlbaniaAlgeriaAmerican SamoaAndorraAngolaAntigua and BarbudaArab WorldArgentinaArmeniaArubaAustraliaAustriaAzerbaijanBahamas, TheBahrainBangladeshBarbadosBelarusBelgiumBelizeBeninBermudaBhutanBoliviaBosnia and HerzegovinaBotswanaBrazilBritish Virgin IslandsBrunei DarussalamBulgariaBurkina FasoBurundiCabo VerdeCambodiaCameroonCanadaCaribbean small statesCayman IslandsCentral African RepublicCentral Europe and the BalticsChadChannel IslandsChileChinaColombiaComorosCongo, Dem. Rep.Congo, Rep.Costa RicaCote d'IvoireCroatiaCubaCuracaoCyprusCzech RepublicDenmarkDjiboutiDominicaDominican RepublicEarly-demographic dividendEast Asia & PacificEast Asia & Pacific (excluding high income)East Asia & Pacific (IDA & IBRD countries)EcuadorEgypt, Arab Rep.El SalvadorEquatorial GuineaEritreaEstoniaEthiopiaEuro areaEurope & Central AsiaEurope & Central Asia (excluding high income)Europe & Central Asia (IDA & IBRD countries)European UnionFaroe IslandsFijiFinlandFragile and conflict affected situationsFranceFrench PolynesiaGabonGambia, TheGeorgiaGermanyGhanaGibraltarGreeceGreenlandGrenadaGuamGuatemalaGuineaGuinea-BissauGuyanaHaitiHeavily indebted poor countries (HIPC)High incomeHondurasHong Kong SAR, ChinaHungaryIBRD onlyIcelandIDA & IBRD totalIDA blendIDA onlyIDA totalIndiaIndonesiaIran, Islamic Rep.IraqIrelandIsle of ManIsraelItalyJamaicaJapanJordanKazakhstanKenyaKiribatiKorea, Dem. People’s Rep.Korea, Rep.KosovoKuwaitKyrgyz RepublicLao PDRLate-demographic dividendLatin America & Caribbean Latin America & Caribbean (excluding high income)Latin America & the Caribbean (IDA & IBRD countries)LatviaLeast developed countries: UN classificationLebanonLesothoLiberiaLibyaLiechtensteinLithuaniaLow & middle incomeLow incomeLower middle incomeLuxembourgMacao SAR, ChinaMacedonia, FYRMadagascarMalawiMalaysiaMaldivesMaliMaltaMarshall IslandsMauritaniaMauritiusMexicoMicronesia, Fed. Sts.Middle East & North AfricaMiddle East & North Africa (excluding high income)Middle East & North Africa (IDA & IBRD countries)Middle incomeMoldovaMonacoMongoliaMontenegroMoroccoMozambiqueMyanmarNamibiaNauruNepalNetherlandsNew CaledoniaNew ZealandNicaraguaNigerNigeriaNorth AmericaNorthern Mariana IslandsNorwayOECD membersOmanOther small statesPacific island small statesPakistanPalauPanamaPapua New GuineaParaguayPeruPhilippinesPolandPortugalPost-demographic dividendPre-demographic dividendPuerto RicoQatarRomaniaRussian FederationRwandaSamoaSan MarinoSao Tome and PrincipeSaudi ArabiaSenegalSerbiaSeychellesSierra LeoneSingaporeSint Maarten (Dutch part)Slovak RepublicSloveniaSmall statesSolomon IslandsSomaliaSouth AfricaSouth AsiaSouth Asia (IDA & IBRD)SpainSri LankaSt. Kitts and NevisSt. LuciaSt. Martin (French part)St. Vincent and the GrenadinesSub-Saharan Africa Sub-Saharan Africa (excluding high income)Sub-Saharan Africa (IDA & IBRD countries)SudanSurinameSwazilandSwedenSwitzerlandSyrian Arab RepublicTajikistanTanzaniaThailandTimor-LesteTogoTongaTrinidad and TobagoTunisiaTurkeyTurkmenistanTurks and Caicos IslandsTuvaluUgandaUkraineUnited Arab EmiratesUnited KingdomUnited StatesUpper middle incomeUruguayUzbekistanVanuatuVenezuela, RBVietnamVirgin Islands (U.S.)West Bank and GazaWorldYemen, Rep.ZambiaZimbabwe Timeline:
This timeline shows a graph from 1962 to 2016 of IDA total. No data until 1961. Number of actual observations by date: 55.
Source name:
World Development Indicators
Source organization:
Food and Agriculture Organization and World Bank population estimates.
Categories, topics:
Urban Development
Last updated:
apr 23, 2017
Indicators value changes by year
Minimum:
15.896
jan 1, 1962
Maximum:
59.748
jan 1, 2016
At the date of observation
Value
Absolute change
Change from previous value
jan 1, 1962
15.896
+15.896
0.0%
jan 1, 1963
16.281
+0.385
2.42%
jan 1, 1964
16.677
+0.395
2.43%
jan 1, 1965
17.095
+0.418
2.51%
jan 1, 1966
17.527
+0.432
2.53%
jan 1, 1967
17.977
+0.451
2.57%
jan 1, 1968
18.445
+0.467
2.6%
jan 1, 1969
18.927
+0.483
2.62%
jan 1, 1970
19.419
+0.492
2.6%
jan 1, 1971
19.918
+0.499
2.57%
jan 1, 1972
20.42
+0.502
2.52%
jan 1, 1973
20.93
+0.51
2.5%
jan 1, 1974
21.455
+0.525
2.51%
jan 1, 1975
21.997
+0.542
2.53%
jan 1, 1976
22.561
+0.565
2.57%
jan 1, 1977
23.15
+0.589
2.61%
jan 1, 1978
23.762
+0.612
2.64%
jan 1, 1979
24.395
+0.634
2.67%
jan 1, 1980
25.05
+0.654
2.68%
jan 1, 1981
25.721
+0.671
2.68%
jan 1, 1982
26.4
+0.679
2.64%
jan 1, 1983
27.101
+0.701
2.66%
jan 1, 1984
27.822
+0.721
2.66%
jan 1, 1985
28.566
+0.744
2.67%
jan 1, 1986
29.337
+0.771
2.7%
jan 1, 1987
30.138
+0.8
2.73%
jan 1, 1988
30.963
+0.826
2.74%
jan 1, 1989
31.809
+0.846
2.73%
jan 1, 1990
32.675
+0.866
2.72%
jan 1, 1991
33.548
+0.873
2.67%
jan 1, 1992
34.438
+0.89
2.65%
jan 1, 1993
35.347
+0.909
2.64%
jan 1, 1994
36.267
+0.92
2.6%
jan 1, 1995
37.202
+0.935
2.58%
jan 1, 1996
38.133
+0.931
2.5%
jan 1, 1997
39.07
+0.936
2.46%
jan 1, 1998
40.01
+0.94
2.41%
jan 1, 1999
40.951
+0.942
2.35%
jan 1, 2000
41.898
+0.946
2.31%
jan 1, 2001
42.885
+0.988
2.36%
jan 1, 2002
43.868
+0.983
2.29%
jan 1, 2003
44.866
+0.997
2.27%
jan 1, 2004
45.881
+1.015
2.26%
jan 1, 2005
46.919
+1.038
2.26%
jan 1, 2006
47.973
+1.054
2.25%
jan 1, 2007
49.046
+1.074
2.24%
jan 1, 2008
50.143
+1.096
2.24%
jan 1, 2009
51.262
+1.119
2.23%
jan 1, 2010
52.403
+1.141
2.23%
jan 1, 2011
53.575
+1.172
2.24%
jan 1, 2012
54.768
+1.193
2.23%
jan 1, 2013
55.972
+1.204
2.2%
jan 1, 2014
57.201
+1.229
2.2%
jan 1, 2015
58.461
+1.26
2.2%
jan 1, 2016
59.748
+1.287
2.2%
Ranking of countries by current statistics by years


Comments: