29
/
en
AIzaSyAYiBZKx7MnpbEhh9jyipgxe19OcubqV5w
April 1, 2024
261403
Tanzania
TZA
true
2
1
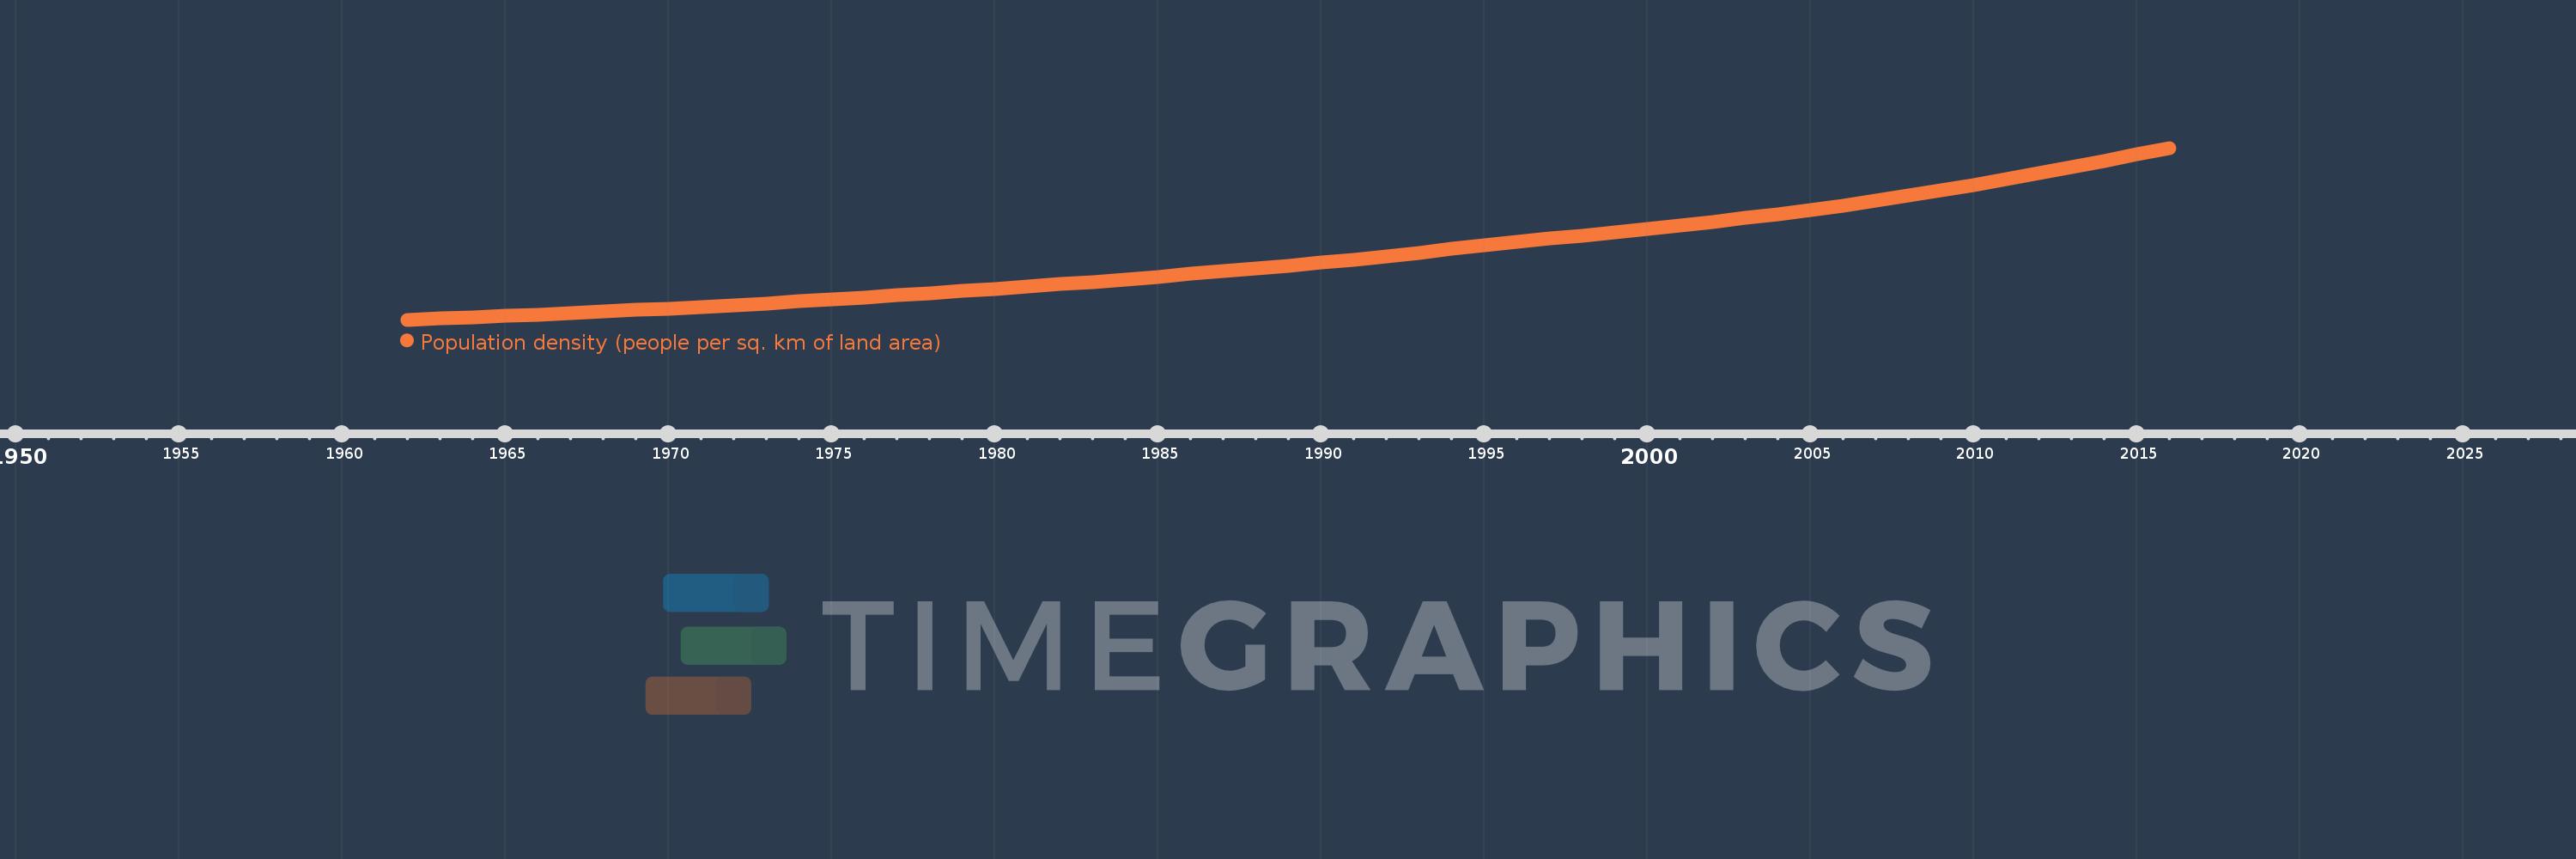
Population density (people per sq. km of land area)
2016,2015,2014,2013,2012,2011,2010,2009,2008,2007,2006,2005,2004,2003,2002,2001,2000,1999,1998,1997,1996,1995,1994,1993,1992,1991,1990,1989,1988,1987,1986,1985,1984,1983,1982,1981,1980,1979,1978,1977,1976,1975,1974,1973,1972,1971,1970,1969,1968,1967,1966,1965,1964,1963,1962
This statistics in other country:
AfghanistanAlbaniaAlgeriaAmerican SamoaAndorraAngolaAntigua and BarbudaArab WorldArgentinaArmeniaArubaAustraliaAustriaAzerbaijanBahamas, TheBahrainBangladeshBarbadosBelarusBelgiumBelizeBeninBermudaBhutanBoliviaBosnia and HerzegovinaBotswanaBrazilBritish Virgin IslandsBrunei DarussalamBulgariaBurkina FasoBurundiCabo VerdeCambodiaCameroonCanadaCaribbean small statesCayman IslandsCentral African RepublicCentral Europe and the BalticsChadChannel IslandsChileChinaColombiaComorosCongo, Dem. Rep.Congo, Rep.Costa RicaCote d'IvoireCroatiaCubaCuracaoCyprusCzech RepublicDenmarkDjiboutiDominicaDominican RepublicEarly-demographic dividendEast Asia & PacificEast Asia & Pacific (excluding high income)East Asia & Pacific (IDA & IBRD countries)EcuadorEgypt, Arab Rep.El SalvadorEquatorial GuineaEritreaEstoniaEthiopiaEuro areaEurope & Central AsiaEurope & Central Asia (excluding high income)Europe & Central Asia (IDA & IBRD countries)European UnionFaroe IslandsFijiFinlandFragile and conflict affected situationsFranceFrench PolynesiaGabonGambia, TheGeorgiaGermanyGhanaGibraltarGreeceGreenlandGrenadaGuamGuatemalaGuineaGuinea-BissauGuyanaHaitiHeavily indebted poor countries (HIPC)High incomeHondurasHong Kong SAR, ChinaHungaryIBRD onlyIcelandIDA & IBRD totalIDA blendIDA onlyIDA totalIndiaIndonesiaIran, Islamic Rep.IraqIrelandIsle of ManIsraelItalyJamaicaJapanJordanKazakhstanKenyaKiribatiKorea, Dem. People’s Rep.Korea, Rep.KosovoKuwaitKyrgyz RepublicLao PDRLate-demographic dividendLatin America & Caribbean Latin America & Caribbean (excluding high income)Latin America & the Caribbean (IDA & IBRD countries)LatviaLeast developed countries: UN classificationLebanonLesothoLiberiaLibyaLiechtensteinLithuaniaLow & middle incomeLow incomeLower middle incomeLuxembourgMacao SAR, ChinaMacedonia, FYRMadagascarMalawiMalaysiaMaldivesMaliMaltaMarshall IslandsMauritaniaMauritiusMexicoMicronesia, Fed. Sts.Middle East & North AfricaMiddle East & North Africa (excluding high income)Middle East & North Africa (IDA & IBRD countries)Middle incomeMoldovaMonacoMongoliaMontenegroMoroccoMozambiqueMyanmarNamibiaNauruNepalNetherlandsNew CaledoniaNew ZealandNicaraguaNigerNigeriaNorth AmericaNorthern Mariana IslandsNorwayOECD membersOmanOther small statesPacific island small statesPakistanPalauPanamaPapua New GuineaParaguayPeruPhilippinesPolandPortugalPost-demographic dividendPre-demographic dividendPuerto RicoQatarRomaniaRussian FederationRwandaSamoaSan MarinoSao Tome and PrincipeSaudi ArabiaSenegalSerbiaSeychellesSierra LeoneSingaporeSint Maarten (Dutch part)Slovak RepublicSloveniaSmall statesSolomon IslandsSomaliaSouth AfricaSouth AsiaSouth Asia (IDA & IBRD)SpainSri LankaSt. Kitts and NevisSt. LuciaSt. Martin (French part)St. Vincent and the GrenadinesSub-Saharan Africa Sub-Saharan Africa (excluding high income)Sub-Saharan Africa (IDA & IBRD countries)SudanSurinameSwazilandSwedenSwitzerlandSyrian Arab RepublicTajikistanTanzaniaThailandTimor-LesteTogoTongaTrinidad and TobagoTunisiaTurkeyTurkmenistanTurks and Caicos IslandsTuvaluUgandaUkraineUnited Arab EmiratesUnited KingdomUnited StatesUpper middle incomeUruguayUzbekistanVanuatuVenezuela, RBVietnamVirgin Islands (U.S.)West Bank and GazaWorldYemen, Rep.ZambiaZimbabwe Timeline:
This timeline shows a graph from 1962 to 2016 of Tanzania. No data until 1961. Number of actual observations by date: 55.
Source name:
World Development Indicators
Source organization:
Food and Agriculture Organization and World Bank population estimates.
Categories, topics:
Urban Development
Last updated:
apr 23, 2017
Indicators value changes by year
Minimum:
11.711
jan 1, 1962
Maximum:
60.364
jan 1, 2016
At the date of observation
Value
Absolute change
Change from previous value
jan 1, 1962
11.711
+11.711
0.0%
jan 1, 1963
12.061
+0.351
2.99%
jan 1, 1964
12.425
+0.364
3.01%
jan 1, 1965
12.801
+0.376
3.03%
jan 1, 1966
13.19
+0.389
3.04%
jan 1, 1967
13.591
+0.401
3.04%
jan 1, 1968
14.005
+0.414
3.05%
jan 1, 1969
14.436
+0.431
3.07%
jan 1, 1970
14.887
+0.451
3.12%
jan 1, 1971
15.36
+0.473
3.18%
jan 1, 1972
15.857
+0.497
3.24%
jan 1, 1973
16.377
+0.52
3.28%
jan 1, 1974
16.917
+0.54
3.3%
jan 1, 1975
17.473
+0.556
3.28%
jan 1, 1976
18.04
+0.568
3.25%
jan 1, 1977
18.62
+0.579
3.21%
jan 1, 1978
19.212
+0.592
3.18%
jan 1, 1979
19.82
+0.608
3.16%
jan 1, 1980
20.446
+0.626
3.16%
jan 1, 1981
21.094
+0.648
3.17%
jan 1, 1982
21.765
+0.671
3.18%
jan 1, 1983
22.46
+0.694
3.19%
jan 1, 1984
23.175
+0.715
3.19%
jan 1, 1985
23.908
+0.733
3.16%
jan 1, 1986
24.658
+0.75
3.14%
jan 1, 1987
25.42
+0.762
3.09%
jan 1, 1988
26.196
+0.776
3.05%
jan 1, 1989
26.998
+0.802
3.06%
jan 1, 1990
27.843
+0.845
3.13%
jan 1, 1991
28.74
+0.897
3.22%
jan 1, 1992
29.699
+0.959
3.34%
jan 1, 1993
30.711
+1.012
3.41%
jan 1, 1994
31.748
+1.037
3.38%
jan 1, 1995
32.773
+1.024
3.23%
jan 1, 1996
33.759
+0.986
3.01%
jan 1, 1997
34.696
+0.938
2.78%
jan 1, 1998
35.599
+0.903
2.6%
jan 1, 1999
36.491
+0.892
2.51%
jan 1, 2000
37.407
+0.916
2.51%
jan 1, 2001
38.374
+0.967
2.58%
jan 1, 2002
39.398
+1.024
2.67%
jan 1, 2003
40.478
+1.08
2.74%
jan 1, 2004
41.619
+1.141
2.82%
jan 1, 2005
42.826
+1.207
2.9%
jan 1, 2006
44.102
+1.276
2.98%
jan 1, 2007
45.451
+1.349
3.06%
jan 1, 2008
46.875
+1.424
3.13%
jan 1, 2009
48.368
+1.493
3.19%
jan 1, 2010
49.923
+1.555
3.21%
jan 1, 2011
51.534
+1.61
3.23%
jan 1, 2012
53.198
+1.665
3.23%
jan 1, 2013
54.917
+1.719
3.23%
jan 1, 2014
56.687
+1.77
3.22%
jan 1, 2015
58.504
+1.817
3.2%
jan 1, 2016
60.364
+1.86
3.18%
Ranking of countries by current statistics by years


Comments: