29
/
en
AIzaSyAYiBZKx7MnpbEhh9jyipgxe19OcubqV5w
April 1, 2024
198059
Moldova
MDA
true
2
1
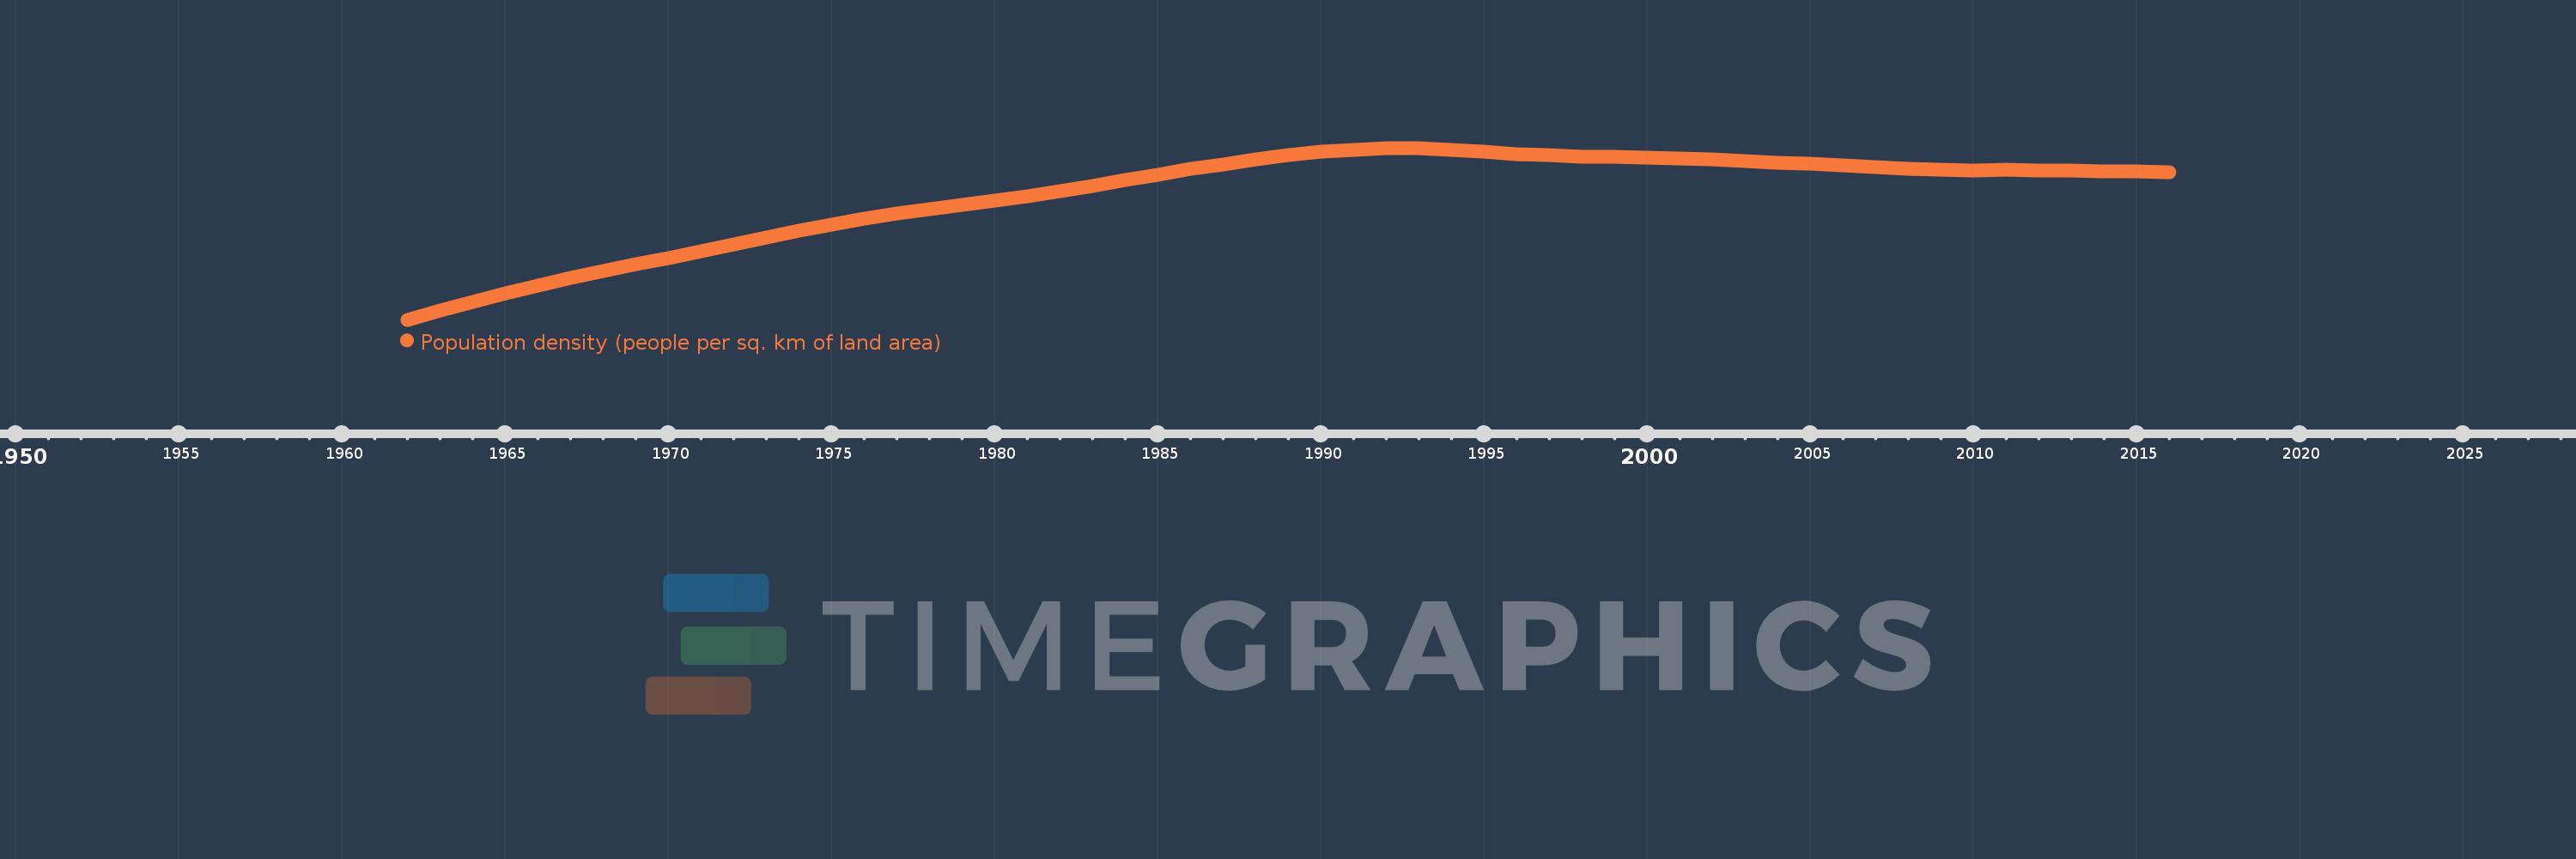
Population density (people per sq. km of land area)
2016,2015,2014,2013,2012,2011,2010,2009,2008,2007,2006,2005,2004,2003,2002,2001,2000,1999,1998,1997,1996,1995,1994,1993,1992,1991,1990,1989,1988,1987,1986,1985,1984,1983,1982,1981,1980,1979,1978,1977,1976,1975,1974,1973,1972,1971,1970,1969,1968,1967,1966,1965,1964,1963,1962
This statistics in other country:
AfghanistanAlbaniaAlgeriaAmerican SamoaAndorraAngolaAntigua and BarbudaArab WorldArgentinaArmeniaArubaAustraliaAustriaAzerbaijanBahamas, TheBahrainBangladeshBarbadosBelarusBelgiumBelizeBeninBermudaBhutanBoliviaBosnia and HerzegovinaBotswanaBrazilBritish Virgin IslandsBrunei DarussalamBulgariaBurkina FasoBurundiCabo VerdeCambodiaCameroonCanadaCaribbean small statesCayman IslandsCentral African RepublicCentral Europe and the BalticsChadChannel IslandsChileChinaColombiaComorosCongo, Dem. Rep.Congo, Rep.Costa RicaCote d'IvoireCroatiaCubaCuracaoCyprusCzech RepublicDenmarkDjiboutiDominicaDominican RepublicEarly-demographic dividendEast Asia & PacificEast Asia & Pacific (excluding high income)East Asia & Pacific (IDA & IBRD countries)EcuadorEgypt, Arab Rep.El SalvadorEquatorial GuineaEritreaEstoniaEthiopiaEuro areaEurope & Central AsiaEurope & Central Asia (excluding high income)Europe & Central Asia (IDA & IBRD countries)European UnionFaroe IslandsFijiFinlandFragile and conflict affected situationsFranceFrench PolynesiaGabonGambia, TheGeorgiaGermanyGhanaGibraltarGreeceGreenlandGrenadaGuamGuatemalaGuineaGuinea-BissauGuyanaHaitiHeavily indebted poor countries (HIPC)High incomeHondurasHong Kong SAR, ChinaHungaryIBRD onlyIcelandIDA & IBRD totalIDA blendIDA onlyIDA totalIndiaIndonesiaIran, Islamic Rep.IraqIrelandIsle of ManIsraelItalyJamaicaJapanJordanKazakhstanKenyaKiribatiKorea, Dem. People’s Rep.Korea, Rep.KosovoKuwaitKyrgyz RepublicLao PDRLate-demographic dividendLatin America & Caribbean Latin America & Caribbean (excluding high income)Latin America & the Caribbean (IDA & IBRD countries)LatviaLeast developed countries: UN classificationLebanonLesothoLiberiaLibyaLiechtensteinLithuaniaLow & middle incomeLow incomeLower middle incomeLuxembourgMacao SAR, ChinaMacedonia, FYRMadagascarMalawiMalaysiaMaldivesMaliMaltaMarshall IslandsMauritaniaMauritiusMexicoMicronesia, Fed. Sts.Middle East & North AfricaMiddle East & North Africa (excluding high income)Middle East & North Africa (IDA & IBRD countries)Middle incomeMoldovaMonacoMongoliaMontenegroMoroccoMozambiqueMyanmarNamibiaNauruNepalNetherlandsNew CaledoniaNew ZealandNicaraguaNigerNigeriaNorth AmericaNorthern Mariana IslandsNorwayOECD membersOmanOther small statesPacific island small statesPakistanPalauPanamaPapua New GuineaParaguayPeruPhilippinesPolandPortugalPost-demographic dividendPre-demographic dividendPuerto RicoQatarRomaniaRussian FederationRwandaSamoaSan MarinoSao Tome and PrincipeSaudi ArabiaSenegalSerbiaSeychellesSierra LeoneSingaporeSint Maarten (Dutch part)Slovak RepublicSloveniaSmall statesSolomon IslandsSomaliaSouth AfricaSouth AsiaSouth Asia (IDA & IBRD)SpainSri LankaSt. Kitts and NevisSt. LuciaSt. Martin (French part)St. Vincent and the GrenadinesSub-Saharan Africa Sub-Saharan Africa (excluding high income)Sub-Saharan Africa (IDA & IBRD countries)SudanSurinameSwazilandSwedenSwitzerlandSyrian Arab RepublicTajikistanTanzaniaThailandTimor-LesteTogoTongaTrinidad and TobagoTunisiaTurkeyTurkmenistanTurks and Caicos IslandsTuvaluUgandaUkraineUnited Arab EmiratesUnited KingdomUnited StatesUpper middle incomeUruguayUzbekistanVanuatuVenezuela, RBVietnamVirgin Islands (U.S.)West Bank and GazaWorldYemen, Rep.ZambiaZimbabwe Timeline:
This timeline shows a graph from 1962 to 2016 of Moldova. No data until 1961. Number of actual observations by date: 55.
Source name:
World Development Indicators
Source organization:
Food and Agriculture Organization and World Bank population estimates.
Categories, topics:
Urban Development
Last updated:
apr 23, 2017
Indicators value changes by year
Minimum:
90.744
jan 1, 1962
Maximum:
129.097
jan 1, 1993
At the date of observation
Value
Absolute change
Change from previous value
jan 1, 1962
90.744
+90.744
0.0%
jan 1, 1963
92.8
+2.055
2.26%
jan 1, 1964
94.785
+1.986
2.14%
jan 1, 1965
96.631
+1.846
1.95%
jan 1, 1966
98.408
+1.777
1.84%
jan 1, 1967
100.08
+1.672
1.7%
jan 1, 1968
101.648
+1.568
1.57%
jan 1, 1969
103.111
+1.463
1.44%
jan 1, 1970
104.574
+1.463
1.42%
jan 1, 1971
106.037
+1.463
1.4%
jan 1, 1972
107.57
+1.533
1.45%
jan 1, 1973
109.067
+1.498
1.39%
jan 1, 1974
110.565
+1.498
1.37%
jan 1, 1975
111.994
+1.428
1.29%
jan 1, 1976
113.248
+1.254
1.12%
jan 1, 1977
114.397
+1.15
1.02%
jan 1, 1978
115.373
+0.975
0.85%
jan 1, 1979
116.313
+0.941
0.82%
jan 1, 1980
117.254
+0.941
0.81%
jan 1, 1981
118.299
+1.045
0.89%
jan 1, 1982
119.448
+1.15
0.97%
jan 1, 1983
120.667
+1.219
1.02%
jan 1, 1984
121.921
+1.254
1.04%
jan 1, 1985
123.176
+1.254
1.03%
jan 1, 1986
124.36
+1.184
0.96%
jan 1, 1987
125.475
+1.115
0.9%
jan 1, 1988
126.554
+1.08
0.86%
jan 1, 1989
127.495
+0.941
0.74%
jan 1, 1990
128.227
+0.732
0.57%
jan 1, 1991
128.749
+0.523
0.41%
jan 1, 1992
129.028
+0.279
0.22%
jan 1, 1993
129.097
+0.07
0.05%
jan 1, 1994
128.565
-0.532
-0.41%
jan 1, 1995
128.262
-0.303
-0.24%
jan 1, 1996
127.754
-0.508
-0.4%
jan 1, 1997
127.498
-0.256
-0.2%
jan 1, 1998
127.072
-0.427
-0.33%
jan 1, 1999
127.065
-0.007
-0.01%
jan 1, 2000
126.91
-0.155
-0.12%
jan 1, 2001
126.74
-0.17
-0.13%
jan 1, 2002
126.457
-0.283
-0.22%
jan 1, 2003
126.164
-0.293
-0.23%
jan 1, 2004
125.853
-0.311
-0.25%
jan 1, 2005
125.499
-0.355
-0.28%
jan 1, 2006
125.15
-0.349
-0.28%
jan 1, 2007
124.803
-0.347
-0.28%
jan 1, 2008
124.514
-0.289
-0.23%
jan 1, 2009
124.277
-0.237
-0.19%
jan 1, 2010
124.12
-0.157
-0.13%
jan 1, 2011
124.169
+0.049
0.04%
jan 1, 2012
124.098
-0.072
-0.06%
jan 1, 2013
124.038
-0.06
-0.05%
jan 1, 2014
123.918
-0.12
-0.1%
jan 1, 2015
123.843
-0.076
-0.06%
jan 1, 2016
123.765
-0.078
-0.06%
Ranking of countries by current statistics by years


Comments: