29
/
en
AIzaSyAYiBZKx7MnpbEhh9jyipgxe19OcubqV5w
April 1, 2024
32013
Europe & Central Asia (excluding high income)
ECA
false
2
1
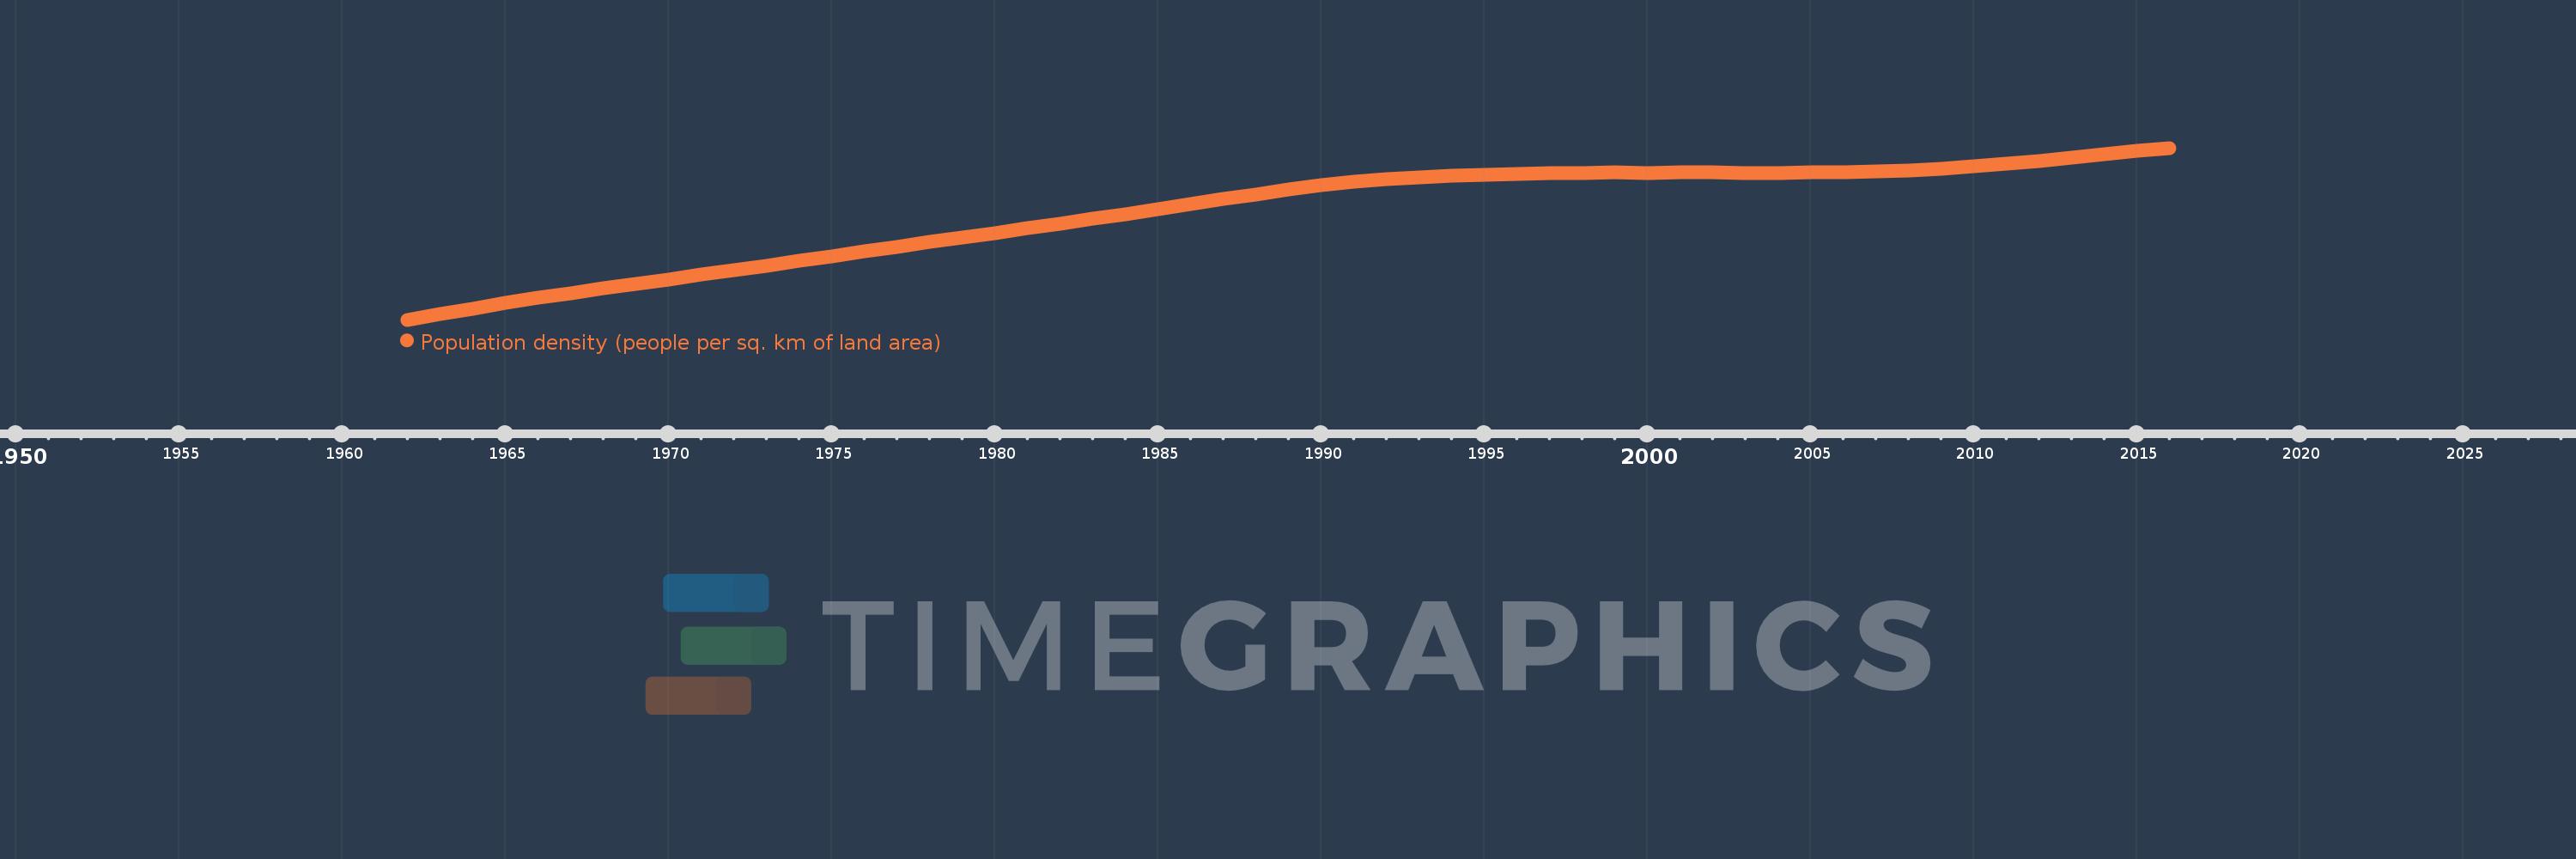
Population density (people per sq. km of land area)
2016,2015,2014,2013,2012,2011,2010,2009,2008,2007,2006,2005,2004,2003,2002,2001,2000,1999,1998,1997,1996,1995,1994,1993,1992,1991,1990,1989,1988,1987,1986,1985,1984,1983,1982,1981,1980,1979,1978,1977,1976,1975,1974,1973,1972,1971,1970,1969,1968,1967,1966,1965,1964,1963,1962
This statistics in other country:
AfghanistanAlbaniaAlgeriaAmerican SamoaAndorraAngolaAntigua and BarbudaArab WorldArgentinaArmeniaArubaAustraliaAustriaAzerbaijanBahamas, TheBahrainBangladeshBarbadosBelarusBelgiumBelizeBeninBermudaBhutanBoliviaBosnia and HerzegovinaBotswanaBrazilBritish Virgin IslandsBrunei DarussalamBulgariaBurkina FasoBurundiCabo VerdeCambodiaCameroonCanadaCaribbean small statesCayman IslandsCentral African RepublicCentral Europe and the BalticsChadChannel IslandsChileChinaColombiaComorosCongo, Dem. Rep.Congo, Rep.Costa RicaCote d'IvoireCroatiaCubaCuracaoCyprusCzech RepublicDenmarkDjiboutiDominicaDominican RepublicEarly-demographic dividendEast Asia & PacificEast Asia & Pacific (excluding high income)East Asia & Pacific (IDA & IBRD countries)EcuadorEgypt, Arab Rep.El SalvadorEquatorial GuineaEritreaEstoniaEthiopiaEuro areaEurope & Central AsiaEurope & Central Asia (excluding high income)Europe & Central Asia (IDA & IBRD countries)European UnionFaroe IslandsFijiFinlandFragile and conflict affected situationsFranceFrench PolynesiaGabonGambia, TheGeorgiaGermanyGhanaGibraltarGreeceGreenlandGrenadaGuamGuatemalaGuineaGuinea-BissauGuyanaHaitiHeavily indebted poor countries (HIPC)High incomeHondurasHong Kong SAR, ChinaHungaryIBRD onlyIcelandIDA & IBRD totalIDA blendIDA onlyIDA totalIndiaIndonesiaIran, Islamic Rep.IraqIrelandIsle of ManIsraelItalyJamaicaJapanJordanKazakhstanKenyaKiribatiKorea, Dem. People’s Rep.Korea, Rep.KosovoKuwaitKyrgyz RepublicLao PDRLate-demographic dividendLatin America & Caribbean Latin America & Caribbean (excluding high income)Latin America & the Caribbean (IDA & IBRD countries)LatviaLeast developed countries: UN classificationLebanonLesothoLiberiaLibyaLiechtensteinLithuaniaLow & middle incomeLow incomeLower middle incomeLuxembourgMacao SAR, ChinaMacedonia, FYRMadagascarMalawiMalaysiaMaldivesMaliMaltaMarshall IslandsMauritaniaMauritiusMexicoMicronesia, Fed. Sts.Middle East & North AfricaMiddle East & North Africa (excluding high income)Middle East & North Africa (IDA & IBRD countries)Middle incomeMoldovaMonacoMongoliaMontenegroMoroccoMozambiqueMyanmarNamibiaNauruNepalNetherlandsNew CaledoniaNew ZealandNicaraguaNigerNigeriaNorth AmericaNorthern Mariana IslandsNorwayOECD membersOmanOther small statesPacific island small statesPakistanPalauPanamaPapua New GuineaParaguayPeruPhilippinesPolandPortugalPost-demographic dividendPre-demographic dividendPuerto RicoQatarRomaniaRussian FederationRwandaSamoaSan MarinoSao Tome and PrincipeSaudi ArabiaSenegalSerbiaSeychellesSierra LeoneSingaporeSint Maarten (Dutch part)Slovak RepublicSloveniaSmall statesSolomon IslandsSomaliaSouth AfricaSouth AsiaSouth Asia (IDA & IBRD)SpainSri LankaSt. Kitts and NevisSt. LuciaSt. Martin (French part)St. Vincent and the GrenadinesSub-Saharan Africa Sub-Saharan Africa (excluding high income)Sub-Saharan Africa (IDA & IBRD countries)SudanSurinameSwazilandSwedenSwitzerlandSyrian Arab RepublicTajikistanTanzaniaThailandTimor-LesteTogoTongaTrinidad and TobagoTunisiaTurkeyTurkmenistanTurks and Caicos IslandsTuvaluUgandaUkraineUnited Arab EmiratesUnited KingdomUnited StatesUpper middle incomeUruguayUzbekistanVanuatuVenezuela, RBVietnamVirgin Islands (U.S.)West Bank and GazaWorldYemen, Rep.ZambiaZimbabwe Timeline:
This timeline shows a graph from 1962 to 2016 of Europe & Central Asia (excluding high income). No data until 1961. Number of actual observations by date: 55.
Source name:
World Development Indicators
Source organization:
Food and Agriculture Organization and World Bank population estimates.
Categories, topics:
Urban Development
Last updated:
apr 23, 2017
Indicators value changes by year
Minimum:
12.345
jan 1, 1962
Maximum:
18.181
jan 1, 2016
At the date of observation
Value
Absolute change
Change from previous value
jan 1, 1962
12.345
+12.345
0.0%
jan 1, 1963
12.535
+0.189
1.53%
jan 1, 1964
12.725
+0.19
1.51%
jan 1, 1965
12.913
+0.189
1.48%
jan 1, 1966
13.098
+0.185
1.43%
jan 1, 1967
13.254
+0.155
1.18%
jan 1, 1968
13.411
+0.157
1.19%
jan 1, 1969
13.564
+0.154
1.15%
jan 1, 1970
13.716
+0.152
1.12%
jan 1, 1971
13.87
+0.154
1.12%
jan 1, 1972
14.026
+0.156
1.13%
jan 1, 1973
14.184
+0.158
1.12%
jan 1, 1974
14.341
+0.158
1.11%
jan 1, 1975
14.5
+0.158
1.1%
jan 1, 1976
14.657
+0.158
1.09%
jan 1, 1977
14.82
+0.163
1.11%
jan 1, 1978
14.979
+0.159
1.07%
jan 1, 1979
15.135
+0.156
1.04%
jan 1, 1980
15.291
+0.156
1.03%
jan 1, 1981
15.452
+0.161
1.05%
jan 1, 1982
15.617
+0.165
1.07%
jan 1, 1983
15.775
+0.158
1.01%
jan 1, 1984
15.932
+0.158
1.0%
jan 1, 1985
16.101
+0.169
1.06%
jan 1, 1986
16.27
+0.169
1.05%
jan 1, 1987
16.437
+0.168
1.03%
jan 1, 1988
16.604
+0.167
1.02%
jan 1, 1989
16.766
+0.161
0.97%
jan 1, 1990
16.92
+0.154
0.92%
jan 1, 1991
17.032
+0.112
0.66%
jan 1, 1992
17.119
+0.087
0.51%
jan 1, 1993
17.189
+0.07
0.41%
jan 1, 1994
17.246
+0.057
0.33%
jan 1, 1995
17.278
+0.031
0.18%
jan 1, 1996
17.299
+0.022
0.13%
jan 1, 1997
17.317
+0.017
0.1%
jan 1, 1998
17.333
+0.017
0.1%
jan 1, 1999
17.344
+0.01
0.06%
jan 1, 2000
17.339
-0.005
-0.03%
jan 1, 2001
17.35
+0.011
0.06%
jan 1, 2002
17.341
-0.009
-0.05%
jan 1, 2003
17.328
-0.013
-0.07%
jan 1, 2004
17.335
+0.006
0.04%
jan 1, 2005
17.35
+0.015
0.09%
jan 1, 2006
17.368
+0.018
0.1%
jan 1, 2007
17.395
+0.027
0.15%
jan 1, 2008
17.425
+0.03
0.17%
jan 1, 2009
17.472
+0.047
0.27%
jan 1, 2010
17.55
+0.078
0.45%
jan 1, 2011
17.642
+0.092
0.52%
jan 1, 2012
17.745
+0.103
0.58%
jan 1, 2013
17.85
+0.105
0.59%
jan 1, 2014
17.965
+0.115
0.64%
jan 1, 2015
18.075
+0.11
0.61%
jan 1, 2016
18.181
+0.106
0.59%
Ranking of countries by current statistics by years


Comments: