29
/
en
AIzaSyAYiBZKx7MnpbEhh9jyipgxe19OcubqV5w
April 1, 2024
53727
Other small states
OSS
false
2
1
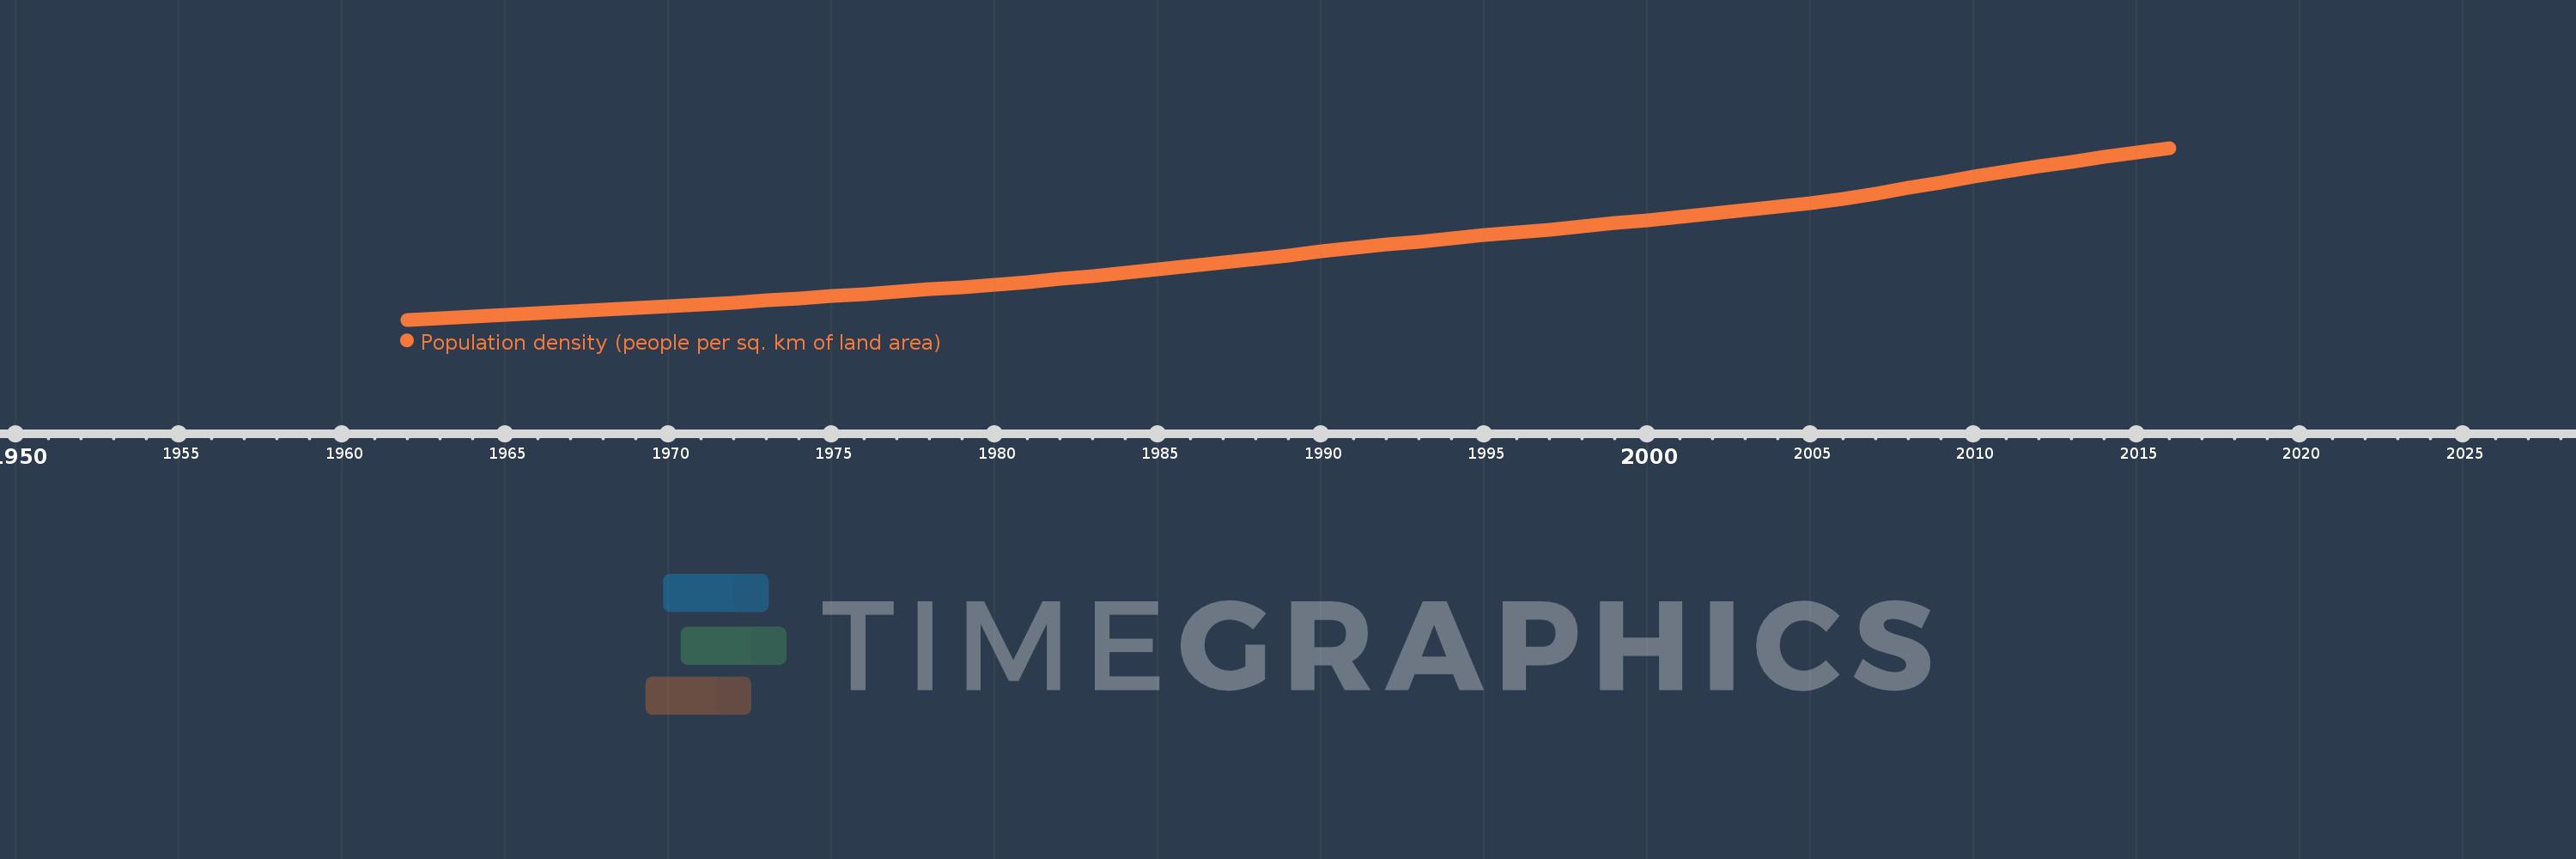
Population density (people per sq. km of land area)
2016,2015,2014,2013,2012,2011,2010,2009,2008,2007,2006,2005,2004,2003,2002,2001,2000,1999,1998,1997,1996,1995,1994,1993,1992,1991,1990,1989,1988,1987,1986,1985,1984,1983,1982,1981,1980,1979,1978,1977,1976,1975,1974,1973,1972,1971,1970,1969,1968,1967,1966,1965,1964,1963,1962
This statistics in other country:
AfghanistanAlbaniaAlgeriaAmerican SamoaAndorraAngolaAntigua and BarbudaArab WorldArgentinaArmeniaArubaAustraliaAustriaAzerbaijanBahamas, TheBahrainBangladeshBarbadosBelarusBelgiumBelizeBeninBermudaBhutanBoliviaBosnia and HerzegovinaBotswanaBrazilBritish Virgin IslandsBrunei DarussalamBulgariaBurkina FasoBurundiCabo VerdeCambodiaCameroonCanadaCaribbean small statesCayman IslandsCentral African RepublicCentral Europe and the BalticsChadChannel IslandsChileChinaColombiaComorosCongo, Dem. Rep.Congo, Rep.Costa RicaCote d'IvoireCroatiaCubaCuracaoCyprusCzech RepublicDenmarkDjiboutiDominicaDominican RepublicEarly-demographic dividendEast Asia & PacificEast Asia & Pacific (excluding high income)East Asia & Pacific (IDA & IBRD countries)EcuadorEgypt, Arab Rep.El SalvadorEquatorial GuineaEritreaEstoniaEthiopiaEuro areaEurope & Central AsiaEurope & Central Asia (excluding high income)Europe & Central Asia (IDA & IBRD countries)European UnionFaroe IslandsFijiFinlandFragile and conflict affected situationsFranceFrench PolynesiaGabonGambia, TheGeorgiaGermanyGhanaGibraltarGreeceGreenlandGrenadaGuamGuatemalaGuineaGuinea-BissauGuyanaHaitiHeavily indebted poor countries (HIPC)High incomeHondurasHong Kong SAR, ChinaHungaryIBRD onlyIcelandIDA & IBRD totalIDA blendIDA onlyIDA totalIndiaIndonesiaIran, Islamic Rep.IraqIrelandIsle of ManIsraelItalyJamaicaJapanJordanKazakhstanKenyaKiribatiKorea, Dem. People’s Rep.Korea, Rep.KosovoKuwaitKyrgyz RepublicLao PDRLate-demographic dividendLatin America & Caribbean Latin America & Caribbean (excluding high income)Latin America & the Caribbean (IDA & IBRD countries)LatviaLeast developed countries: UN classificationLebanonLesothoLiberiaLibyaLiechtensteinLithuaniaLow & middle incomeLow incomeLower middle incomeLuxembourgMacao SAR, ChinaMacedonia, FYRMadagascarMalawiMalaysiaMaldivesMaliMaltaMarshall IslandsMauritaniaMauritiusMexicoMicronesia, Fed. Sts.Middle East & North AfricaMiddle East & North Africa (excluding high income)Middle East & North Africa (IDA & IBRD countries)Middle incomeMoldovaMonacoMongoliaMontenegroMoroccoMozambiqueMyanmarNamibiaNauruNepalNetherlandsNew CaledoniaNew ZealandNicaraguaNigerNigeriaNorth AmericaNorthern Mariana IslandsNorwayOECD membersOmanOther small statesPacific island small statesPakistanPalauPanamaPapua New GuineaParaguayPeruPhilippinesPolandPortugalPost-demographic dividendPre-demographic dividendPuerto RicoQatarRomaniaRussian FederationRwandaSamoaSan MarinoSao Tome and PrincipeSaudi ArabiaSenegalSerbiaSeychellesSierra LeoneSingaporeSint Maarten (Dutch part)Slovak RepublicSloveniaSmall statesSolomon IslandsSomaliaSouth AfricaSouth AsiaSouth Asia (IDA & IBRD)SpainSri LankaSt. Kitts and NevisSt. LuciaSt. Martin (French part)St. Vincent and the GrenadinesSub-Saharan Africa Sub-Saharan Africa (excluding high income)Sub-Saharan Africa (IDA & IBRD countries)SudanSurinameSwazilandSwedenSwitzerlandSyrian Arab RepublicTajikistanTanzaniaThailandTimor-LesteTogoTongaTrinidad and TobagoTunisiaTurkeyTurkmenistanTurks and Caicos IslandsTuvaluUgandaUkraineUnited Arab EmiratesUnited KingdomUnited StatesUpper middle incomeUruguayUzbekistanVanuatuVenezuela, RBVietnamVirgin Islands (U.S.)West Bank and GazaWorldYemen, Rep.ZambiaZimbabwe Timeline:
This timeline shows a graph from 1962 to 2016 of Other small states. No data until 1961. Number of actual observations by date: 55.
Source name:
World Development Indicators
Source organization:
Food and Agriculture Organization and World Bank population estimates.
Categories, topics:
Urban Development
Last updated:
apr 23, 2017
Indicators value changes by year
At the date of observation
Value
Absolute change
Change from previous value
jan 1, 1962
4.59
+4.59
0.0%
jan 1, 1963
4.674
+0.084
1.83%
jan 1, 1964
4.759
+0.086
1.83%
jan 1, 1965
4.848
+0.089
1.86%
jan 1, 1966
4.939
+0.091
1.88%
jan 1, 1967
5.032
+0.092
1.87%
jan 1, 1968
5.126
+0.094
1.87%
jan 1, 1969
5.224
+0.098
1.92%
jan 1, 1970
5.326
+0.102
1.96%
jan 1, 1971
5.433
+0.106
1.99%
jan 1, 1972
5.544
+0.112
2.06%
jan 1, 1973
5.66
+0.115
2.08%
jan 1, 1974
5.777
+0.117
2.08%
jan 1, 1975
5.897
+0.119
2.07%
jan 1, 1976
6.019
+0.123
2.08%
jan 1, 1977
6.143
+0.123
2.05%
jan 1, 1978
6.269
+0.126
2.05%
jan 1, 1979
6.398
+0.129
2.06%
jan 1, 1980
6.536
+0.138
2.15%
jan 1, 1981
6.683
+0.147
2.25%
jan 1, 1982
6.838
+0.156
2.33%
jan 1, 1983
7.003
+0.165
2.42%
jan 1, 1984
7.174
+0.171
2.44%
jan 1, 1985
7.353
+0.178
2.49%
jan 1, 1986
7.542
+0.189
2.57%
jan 1, 1987
7.74
+0.199
2.64%
jan 1, 1988
7.948
+0.207
2.68%
jan 1, 1989
8.157
+0.209
2.63%
jan 1, 1990
8.362
+0.205
2.51%
jan 1, 1991
8.554
+0.192
2.3%
jan 1, 1992
8.742
+0.188
2.2%
jan 1, 1993
8.91
+0.168
1.92%
jan 1, 1994
9.067
+0.157
1.77%
jan 1, 1995
9.256
+0.189
2.08%
jan 1, 1996
9.416
+0.16
1.73%
jan 1, 1997
9.58
+0.164
1.74%
jan 1, 1998
9.747
+0.167
1.74%
jan 1, 1999
9.919
+0.172
1.76%
jan 1, 2000
10.098
+0.18
1.81%
jan 1, 2001
10.287
+0.189
1.87%
jan 1, 2002
10.465
+0.177
1.72%
jan 1, 2003
10.643
+0.179
1.71%
jan 1, 2004
10.831
+0.188
1.77%
jan 1, 2005
11.05
+0.218
2.01%
jan 1, 2006
11.288
+0.239
2.16%
jan 1, 2007
11.561
+0.272
2.41%
jan 1, 2008
11.862
+0.302
2.61%
jan 1, 2009
12.179
+0.317
2.67%
jan 1, 2010
12.485
+0.306
2.51%
jan 1, 2011
12.782
+0.297
2.38%
jan 1, 2012
13.06
+0.278
2.18%
jan 1, 2013
13.326
+0.266
2.04%
jan 1, 2014
13.582
+0.256
1.92%
jan 1, 2015
13.832
+0.25
1.84%
jan 1, 2016
14.08
+0.249
1.8%
Ranking of countries by current statistics by years


Comments: