29
/
en
AIzaSyAYiBZKx7MnpbEhh9jyipgxe19OcubqV5w
April 1, 2024
252303
St. Vincent and the Grenadines
VCT
true
2
1
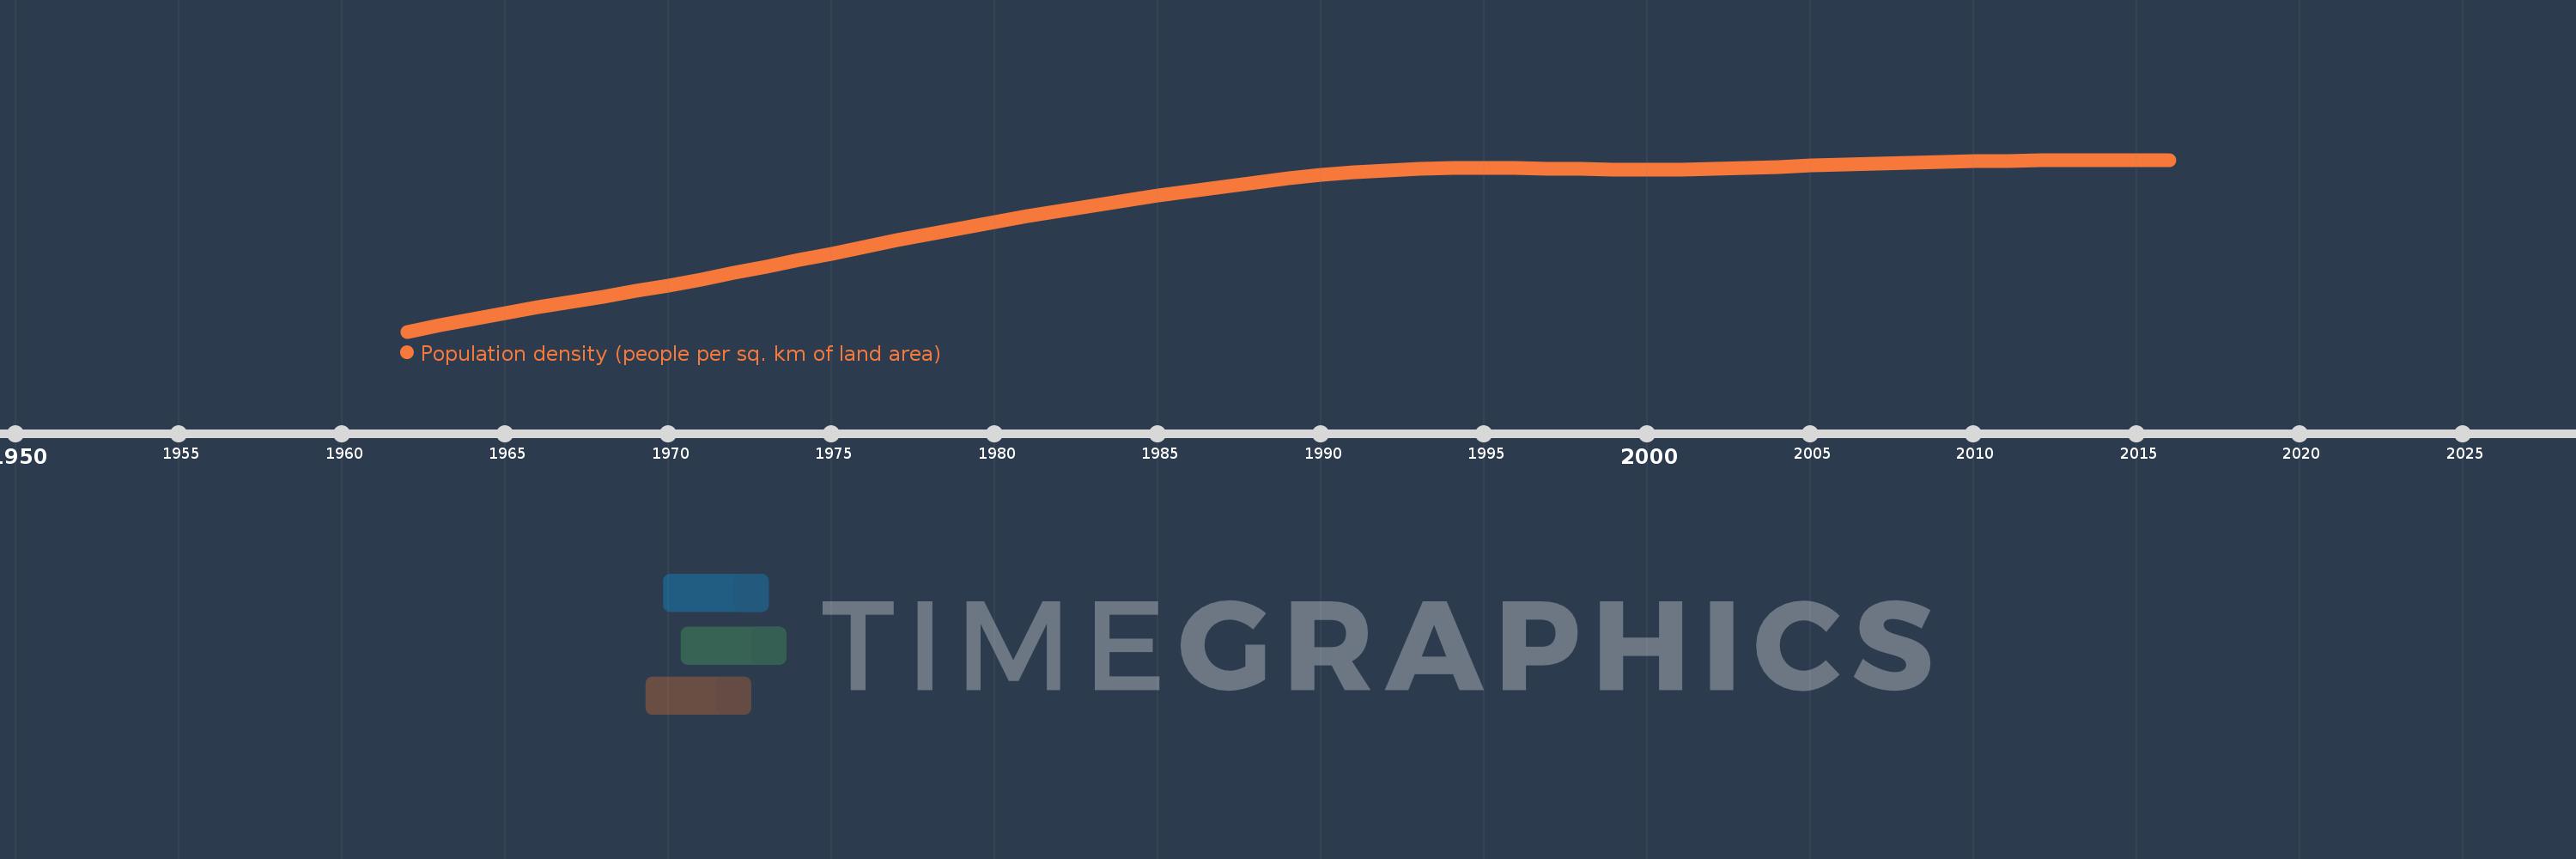
Population density (people per sq. km of land area)
2016,2015,2014,2013,2012,2011,2010,2009,2008,2007,2006,2005,2004,2003,2002,2001,2000,1999,1998,1997,1996,1995,1994,1993,1992,1991,1990,1989,1988,1987,1986,1985,1984,1983,1982,1981,1980,1979,1978,1977,1976,1975,1974,1973,1972,1971,1970,1969,1968,1967,1966,1965,1964,1963,1962
This statistics in other country:
AfghanistanAlbaniaAlgeriaAmerican SamoaAndorraAngolaAntigua and BarbudaArab WorldArgentinaArmeniaArubaAustraliaAustriaAzerbaijanBahamas, TheBahrainBangladeshBarbadosBelarusBelgiumBelizeBeninBermudaBhutanBoliviaBosnia and HerzegovinaBotswanaBrazilBritish Virgin IslandsBrunei DarussalamBulgariaBurkina FasoBurundiCabo VerdeCambodiaCameroonCanadaCaribbean small statesCayman IslandsCentral African RepublicCentral Europe and the BalticsChadChannel IslandsChileChinaColombiaComorosCongo, Dem. Rep.Congo, Rep.Costa RicaCote d'IvoireCroatiaCubaCuracaoCyprusCzech RepublicDenmarkDjiboutiDominicaDominican RepublicEarly-demographic dividendEast Asia & PacificEast Asia & Pacific (excluding high income)East Asia & Pacific (IDA & IBRD countries)EcuadorEgypt, Arab Rep.El SalvadorEquatorial GuineaEritreaEstoniaEthiopiaEuro areaEurope & Central AsiaEurope & Central Asia (excluding high income)Europe & Central Asia (IDA & IBRD countries)European UnionFaroe IslandsFijiFinlandFragile and conflict affected situationsFranceFrench PolynesiaGabonGambia, TheGeorgiaGermanyGhanaGibraltarGreeceGreenlandGrenadaGuamGuatemalaGuineaGuinea-BissauGuyanaHaitiHeavily indebted poor countries (HIPC)High incomeHondurasHong Kong SAR, ChinaHungaryIBRD onlyIcelandIDA & IBRD totalIDA blendIDA onlyIDA totalIndiaIndonesiaIran, Islamic Rep.IraqIrelandIsle of ManIsraelItalyJamaicaJapanJordanKazakhstanKenyaKiribatiKorea, Dem. People’s Rep.Korea, Rep.KosovoKuwaitKyrgyz RepublicLao PDRLate-demographic dividendLatin America & Caribbean Latin America & Caribbean (excluding high income)Latin America & the Caribbean (IDA & IBRD countries)LatviaLeast developed countries: UN classificationLebanonLesothoLiberiaLibyaLiechtensteinLithuaniaLow & middle incomeLow incomeLower middle incomeLuxembourgMacao SAR, ChinaMacedonia, FYRMadagascarMalawiMalaysiaMaldivesMaliMaltaMarshall IslandsMauritaniaMauritiusMexicoMicronesia, Fed. Sts.Middle East & North AfricaMiddle East & North Africa (excluding high income)Middle East & North Africa (IDA & IBRD countries)Middle incomeMoldovaMonacoMongoliaMontenegroMoroccoMozambiqueMyanmarNamibiaNauruNepalNetherlandsNew CaledoniaNew ZealandNicaraguaNigerNigeriaNorth AmericaNorthern Mariana IslandsNorwayOECD membersOmanOther small statesPacific island small statesPakistanPalauPanamaPapua New GuineaParaguayPeruPhilippinesPolandPortugalPost-demographic dividendPre-demographic dividendPuerto RicoQatarRomaniaRussian FederationRwandaSamoaSan MarinoSao Tome and PrincipeSaudi ArabiaSenegalSerbiaSeychellesSierra LeoneSingaporeSint Maarten (Dutch part)Slovak RepublicSloveniaSmall statesSolomon IslandsSomaliaSouth AfricaSouth AsiaSouth Asia (IDA & IBRD)SpainSri LankaSt. Kitts and NevisSt. LuciaSt. Martin (French part)St. Vincent and the GrenadinesSub-Saharan Africa Sub-Saharan Africa (excluding high income)Sub-Saharan Africa (IDA & IBRD countries)SudanSurinameSwazilandSwedenSwitzerlandSyrian Arab RepublicTajikistanTanzaniaThailandTimor-LesteTogoTongaTrinidad and TobagoTunisiaTurkeyTurkmenistanTurks and Caicos IslandsTuvaluUgandaUkraineUnited Arab EmiratesUnited KingdomUnited StatesUpper middle incomeUruguayUzbekistanVanuatuVenezuela, RBVietnamVirgin Islands (U.S.)West Bank and GazaWorldYemen, Rep.ZambiaZimbabwe Timeline:
This timeline shows a graph from 1962 to 2016 of St. Vincent and the Grenadines. No data until 1961. Number of actual observations by date: 55.
Source name:
World Development Indicators
Source organization:
Food and Agriculture Organization and World Bank population estimates.
Categories, topics:
Urban Development
Last updated:
apr 23, 2017
Indicators value changes by year
Minimum:
210.626
jan 1, 1962
Maximum:
280.672
jan 1, 2016
At the date of observation
Value
Absolute change
Change from previous value
jan 1, 1962
210.626
+210.626
0.0%
jan 1, 1963
213.349
+2.723
1.29%
jan 1, 1964
215.813
+2.464
1.15%
jan 1, 1965
218.144
+2.331
1.08%
jan 1, 1966
220.441
+2.297
1.05%
jan 1, 1967
222.718
+2.277
1.03%
jan 1, 1968
224.964
+2.246
1.01%
jan 1, 1969
227.218
+2.254
1.0%
jan 1, 1970
229.533
+2.315
1.02%
jan 1, 1971
231.941
+2.408
1.05%
jan 1, 1972
234.462
+2.521
1.09%
jan 1, 1973
237.09
+2.628
1.12%
jan 1, 1974
239.785
+2.695
1.14%
jan 1, 1975
242.492
+2.708
1.13%
jan 1, 1976
245.164
+2.672
1.1%
jan 1, 1977
247.792
+2.628
1.07%
jan 1, 1978
250.382
+2.59
1.05%
jan 1, 1979
252.908
+2.526
1.01%
jan 1, 1980
255.356
+2.449
0.97%
jan 1, 1981
257.708
+2.351
0.92%
jan 1, 1982
259.944
+2.236
0.87%
jan 1, 1983
262.056
+2.113
0.81%
jan 1, 1984
264.064
+2.008
0.77%
jan 1, 1985
266.005
+1.941
0.74%
jan 1, 1986
267.89
+1.885
0.71%
jan 1, 1987
269.736
+1.846
0.69%
jan 1, 1988
271.518
+1.782
0.66%
jan 1, 1989
273.162
+1.644
0.61%
jan 1, 1990
274.567
+1.405
0.51%
jan 1, 1991
275.664
+1.097
0.4%
jan 1, 1992
276.438
+0.774
0.28%
jan 1, 1993
276.926
+0.487
0.18%
jan 1, 1994
277.172
+0.246
0.09%
jan 1, 1995
277.254
+0.082
0.03%
jan 1, 1996
277.236
-0.018
-0.01%
jan 1, 1997
277.123
-0.113
-0.04%
jan 1, 1998
276.926
-0.197
-0.07%
jan 1, 1999
276.726
-0.2
-0.07%
jan 1, 2000
276.613
-0.113
-0.04%
jan 1, 2001
276.659
+0.046
0.02%
jan 1, 2002
276.895
+0.236
0.09%
jan 1, 2003
277.308
+0.413
0.15%
jan 1, 2004
277.831
+0.523
0.19%
jan 1, 2005
278.367
+0.536
0.19%
jan 1, 2006
278.844
+0.477
0.17%
jan 1, 2007
279.251
+0.408
0.15%
jan 1, 2008
279.613
+0.362
0.13%
jan 1, 2009
279.91
+0.297
0.11%
jan 1, 2010
280.141
+0.231
0.08%
jan 1, 2011
280.297
+0.156
0.06%
jan 1, 2012
280.362
+0.064
0.02%
jan 1, 2013
280.344
-0.018
-0.01%
jan 1, 2014
280.326
-0.018
-0.01%
jan 1, 2015
280.41
+0.085
0.03%
jan 1, 2016
280.672
+0.262
0.09%
Ranking of countries by current statistics by years


Comments: