29
/
en
AIzaSyAYiBZKx7MnpbEhh9jyipgxe19OcubqV5w
April 1, 2024
119290
Denmark
DNK
true
2
1
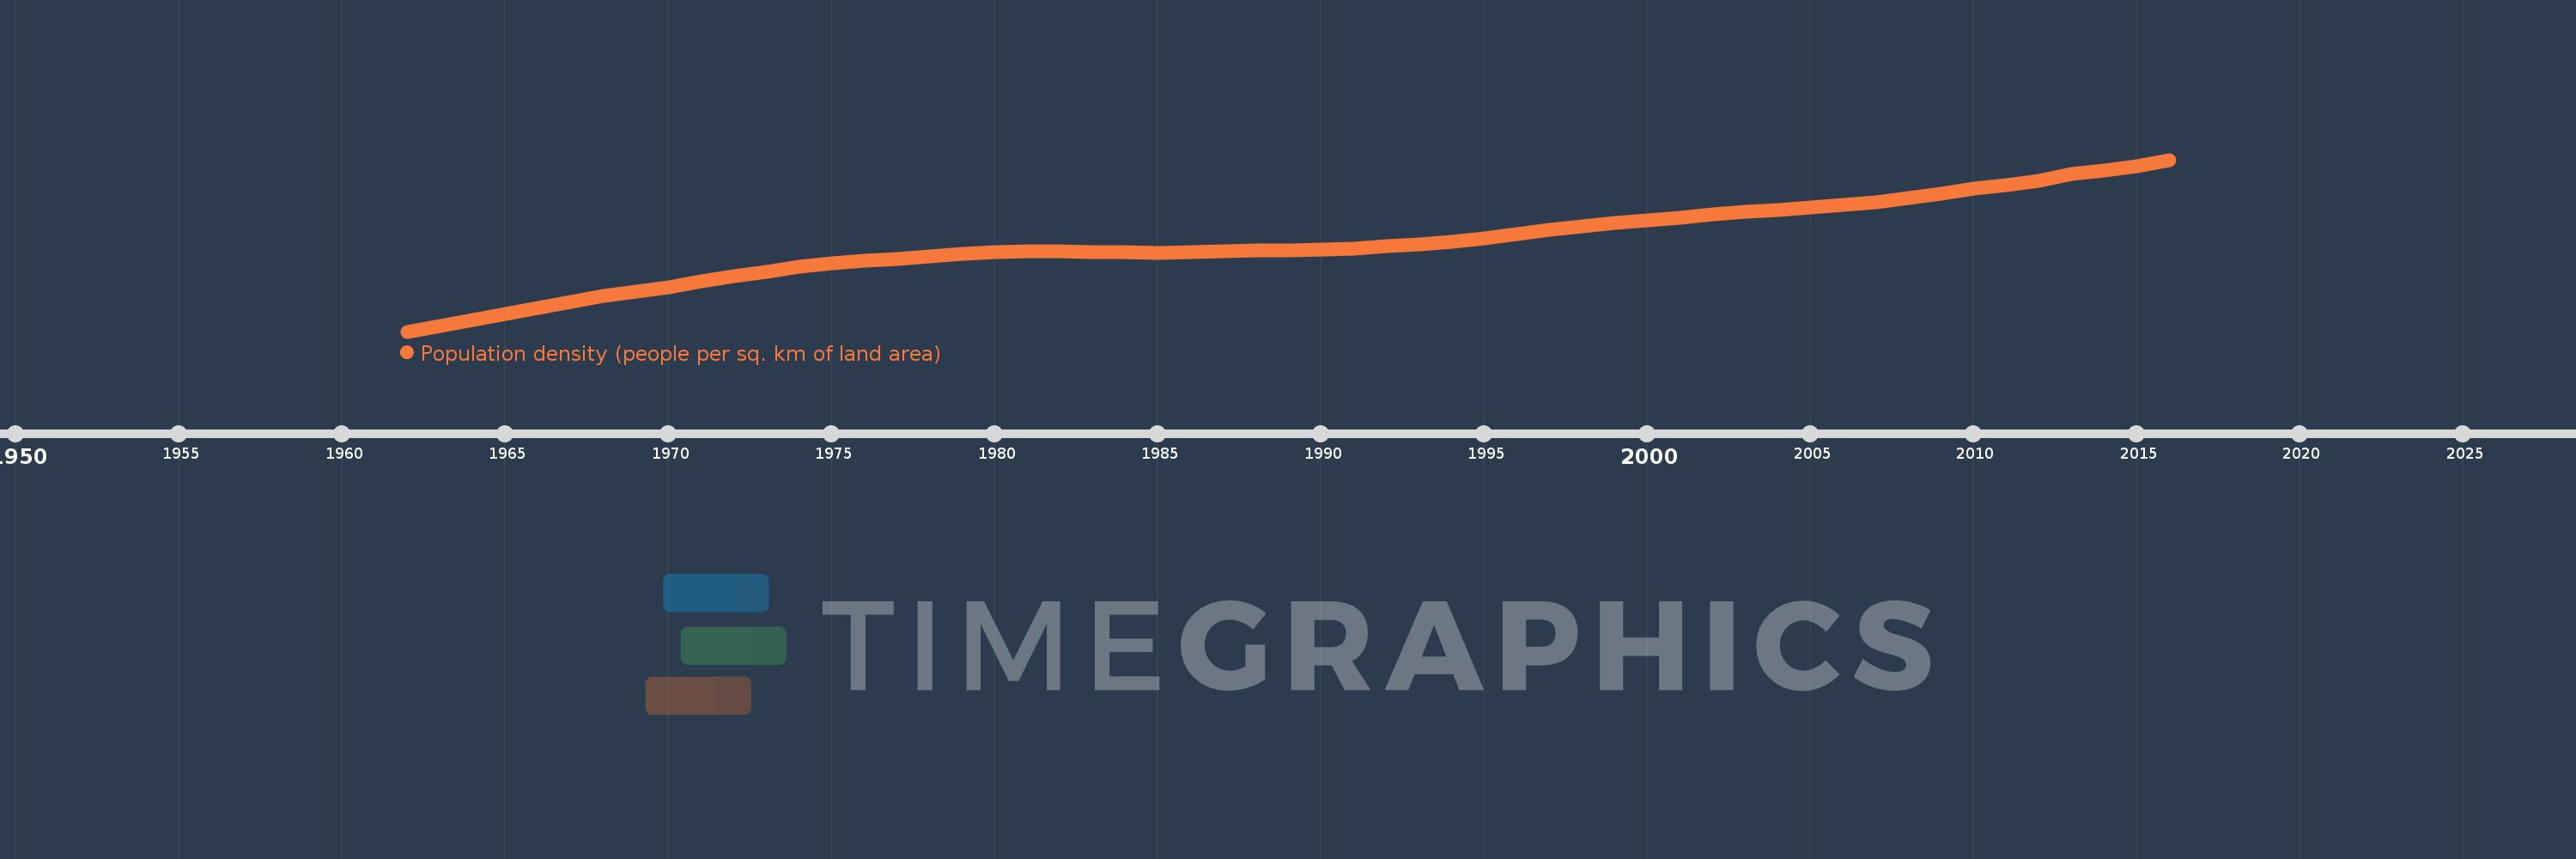
Population density (people per sq. km of land area)
2016,2015,2014,2013,2012,2011,2010,2009,2008,2007,2006,2005,2004,2003,2002,2001,2000,1999,1998,1997,1996,1995,1994,1993,1992,1991,1990,1989,1988,1987,1986,1985,1984,1983,1982,1981,1980,1979,1978,1977,1976,1975,1974,1973,1972,1971,1970,1969,1968,1967,1966,1965,1964,1963,1962
This statistics in other country:
AfghanistanAlbaniaAlgeriaAmerican SamoaAndorraAngolaAntigua and BarbudaArab WorldArgentinaArmeniaArubaAustraliaAustriaAzerbaijanBahamas, TheBahrainBangladeshBarbadosBelarusBelgiumBelizeBeninBermudaBhutanBoliviaBosnia and HerzegovinaBotswanaBrazilBritish Virgin IslandsBrunei DarussalamBulgariaBurkina FasoBurundiCabo VerdeCambodiaCameroonCanadaCaribbean small statesCayman IslandsCentral African RepublicCentral Europe and the BalticsChadChannel IslandsChileChinaColombiaComorosCongo, Dem. Rep.Congo, Rep.Costa RicaCote d'IvoireCroatiaCubaCuracaoCyprusCzech RepublicDenmarkDjiboutiDominicaDominican RepublicEarly-demographic dividendEast Asia & PacificEast Asia & Pacific (excluding high income)East Asia & Pacific (IDA & IBRD countries)EcuadorEgypt, Arab Rep.El SalvadorEquatorial GuineaEritreaEstoniaEthiopiaEuro areaEurope & Central AsiaEurope & Central Asia (excluding high income)Europe & Central Asia (IDA & IBRD countries)European UnionFaroe IslandsFijiFinlandFragile and conflict affected situationsFranceFrench PolynesiaGabonGambia, TheGeorgiaGermanyGhanaGibraltarGreeceGreenlandGrenadaGuamGuatemalaGuineaGuinea-BissauGuyanaHaitiHeavily indebted poor countries (HIPC)High incomeHondurasHong Kong SAR, ChinaHungaryIBRD onlyIcelandIDA & IBRD totalIDA blendIDA onlyIDA totalIndiaIndonesiaIran, Islamic Rep.IraqIrelandIsle of ManIsraelItalyJamaicaJapanJordanKazakhstanKenyaKiribatiKorea, Dem. People’s Rep.Korea, Rep.KosovoKuwaitKyrgyz RepublicLao PDRLate-demographic dividendLatin America & Caribbean Latin America & Caribbean (excluding high income)Latin America & the Caribbean (IDA & IBRD countries)LatviaLeast developed countries: UN classificationLebanonLesothoLiberiaLibyaLiechtensteinLithuaniaLow & middle incomeLow incomeLower middle incomeLuxembourgMacao SAR, ChinaMacedonia, FYRMadagascarMalawiMalaysiaMaldivesMaliMaltaMarshall IslandsMauritaniaMauritiusMexicoMicronesia, Fed. Sts.Middle East & North AfricaMiddle East & North Africa (excluding high income)Middle East & North Africa (IDA & IBRD countries)Middle incomeMoldovaMonacoMongoliaMontenegroMoroccoMozambiqueMyanmarNamibiaNauruNepalNetherlandsNew CaledoniaNew ZealandNicaraguaNigerNigeriaNorth AmericaNorthern Mariana IslandsNorwayOECD membersOmanOther small statesPacific island small statesPakistanPalauPanamaPapua New GuineaParaguayPeruPhilippinesPolandPortugalPost-demographic dividendPre-demographic dividendPuerto RicoQatarRomaniaRussian FederationRwandaSamoaSan MarinoSao Tome and PrincipeSaudi ArabiaSenegalSerbiaSeychellesSierra LeoneSingaporeSint Maarten (Dutch part)Slovak RepublicSloveniaSmall statesSolomon IslandsSomaliaSouth AfricaSouth AsiaSouth Asia (IDA & IBRD)SpainSri LankaSt. Kitts and NevisSt. LuciaSt. Martin (French part)St. Vincent and the GrenadinesSub-Saharan Africa Sub-Saharan Africa (excluding high income)Sub-Saharan Africa (IDA & IBRD countries)SudanSurinameSwazilandSwedenSwitzerlandSyrian Arab RepublicTajikistanTanzaniaThailandTimor-LesteTogoTongaTrinidad and TobagoTunisiaTurkeyTurkmenistanTurks and Caicos IslandsTuvaluUgandaUkraineUnited Arab EmiratesUnited KingdomUnited StatesUpper middle incomeUruguayUzbekistanVanuatuVenezuela, RBVietnamVirgin Islands (U.S.)West Bank and GazaWorldYemen, Rep.ZambiaZimbabwe Timeline:
This timeline shows a graph from 1962 to 2016 of Denmark. No data until 1961. Number of actual observations by date: 55.
Source name:
World Development Indicators
Source organization:
Food and Agriculture Organization and World Bank population estimates.
Categories, topics:
Urban Development
Last updated:
apr 23, 2017
Indicators value changes by year
Minimum:
108.843
jan 1, 1962
Maximum:
134.482
jan 1, 2016
At the date of observation
Value
Absolute change
Change from previous value
jan 1, 1962
108.843
+108.843
0.0%
jan 1, 1963
109.694
+0.851
0.78%
jan 1, 1964
110.561
+0.868
0.79%
jan 1, 1965
111.448
+0.887
0.8%
jan 1, 1966
112.32
+0.872
0.78%
jan 1, 1967
113.226
+0.906
0.81%
jan 1, 1968
114.122
+0.896
0.79%
jan 1, 1969
114.819
+0.697
0.61%
jan 1, 1970
115.456
+0.637
0.55%
jan 1, 1971
116.327
+0.871
0.75%
jan 1, 1972
117.138
+0.811
0.7%
jan 1, 1973
117.81
+0.672
0.57%
jan 1, 1974
118.524
+0.714
0.61%
jan 1, 1975
119.077
+0.553
0.47%
jan 1, 1976
119.421
+0.344
0.29%
jan 1, 1977
119.721
+0.301
0.25%
jan 1, 1978
120.095
+0.373
0.31%
jan 1, 1979
120.468
+0.374
0.31%
jan 1, 1980
120.736
+0.268
0.22%
jan 1, 1981
120.883
+0.147
0.12%
jan 1, 1982
120.849
-0.034
-0.03%
jan 1, 1983
120.76
-0.089
-0.07%
jan 1, 1984
120.677
-0.083
-0.07%
jan 1, 1985
120.614
-0.063
-0.05%
jan 1, 1986
120.663
+0.049
0.04%
jan 1, 1987
120.824
+0.161
0.13%
jan 1, 1988
120.949
+0.125
0.1%
jan 1, 1989
121.008
+0.059
0.05%
jan 1, 1990
121.08
+0.073
0.06%
jan 1, 1991
121.277
+0.197
0.16%
jan 1, 1992
121.592
+0.315
0.26%
jan 1, 1993
121.88
+0.288
0.24%
jan 1, 1994
122.287
+0.407
0.33%
jan 1, 1995
122.7
+0.414
0.34%
jan 1, 1996
123.341
+0.641
0.52%
jan 1, 1997
124.041
+0.7
0.57%
jan 1, 1998
124.558
+0.517
0.42%
jan 1, 1999
125.011
+0.453
0.36%
jan 1, 2000
125.425
+0.414
0.33%
jan 1, 2001
125.845
+0.42
0.33%
jan 1, 2002
126.297
+0.452
0.36%
jan 1, 2003
126.701
+0.404
0.32%
jan 1, 2004
127.046
+0.345
0.27%
jan 1, 2005
127.375
+0.329
0.26%
jan 1, 2006
127.726
+0.351
0.28%
jan 1, 2007
128.147
+0.42
0.33%
jan 1, 2008
128.716
+0.57
0.44%
jan 1, 2009
129.475
+0.758
0.59%
jan 1, 2010
130.17
+0.695
0.54%
jan 1, 2011
130.749
+0.579
0.45%
jan 1, 2012
131.289
+0.539
0.41%
jan 1, 2013
132.408
+1.119
0.85%
jan 1, 2014
132.879
+0.471
0.36%
jan 1, 2015
133.535
+0.657
0.49%
jan 1, 2016
134.482
+0.947
0.71%
Ranking of countries by current statistics by years


Comments: