29
/
en
AIzaSyAYiBZKx7MnpbEhh9jyipgxe19OcubqV5w
April 1, 2024
226959
Puerto Rico
PRI
true
2
1
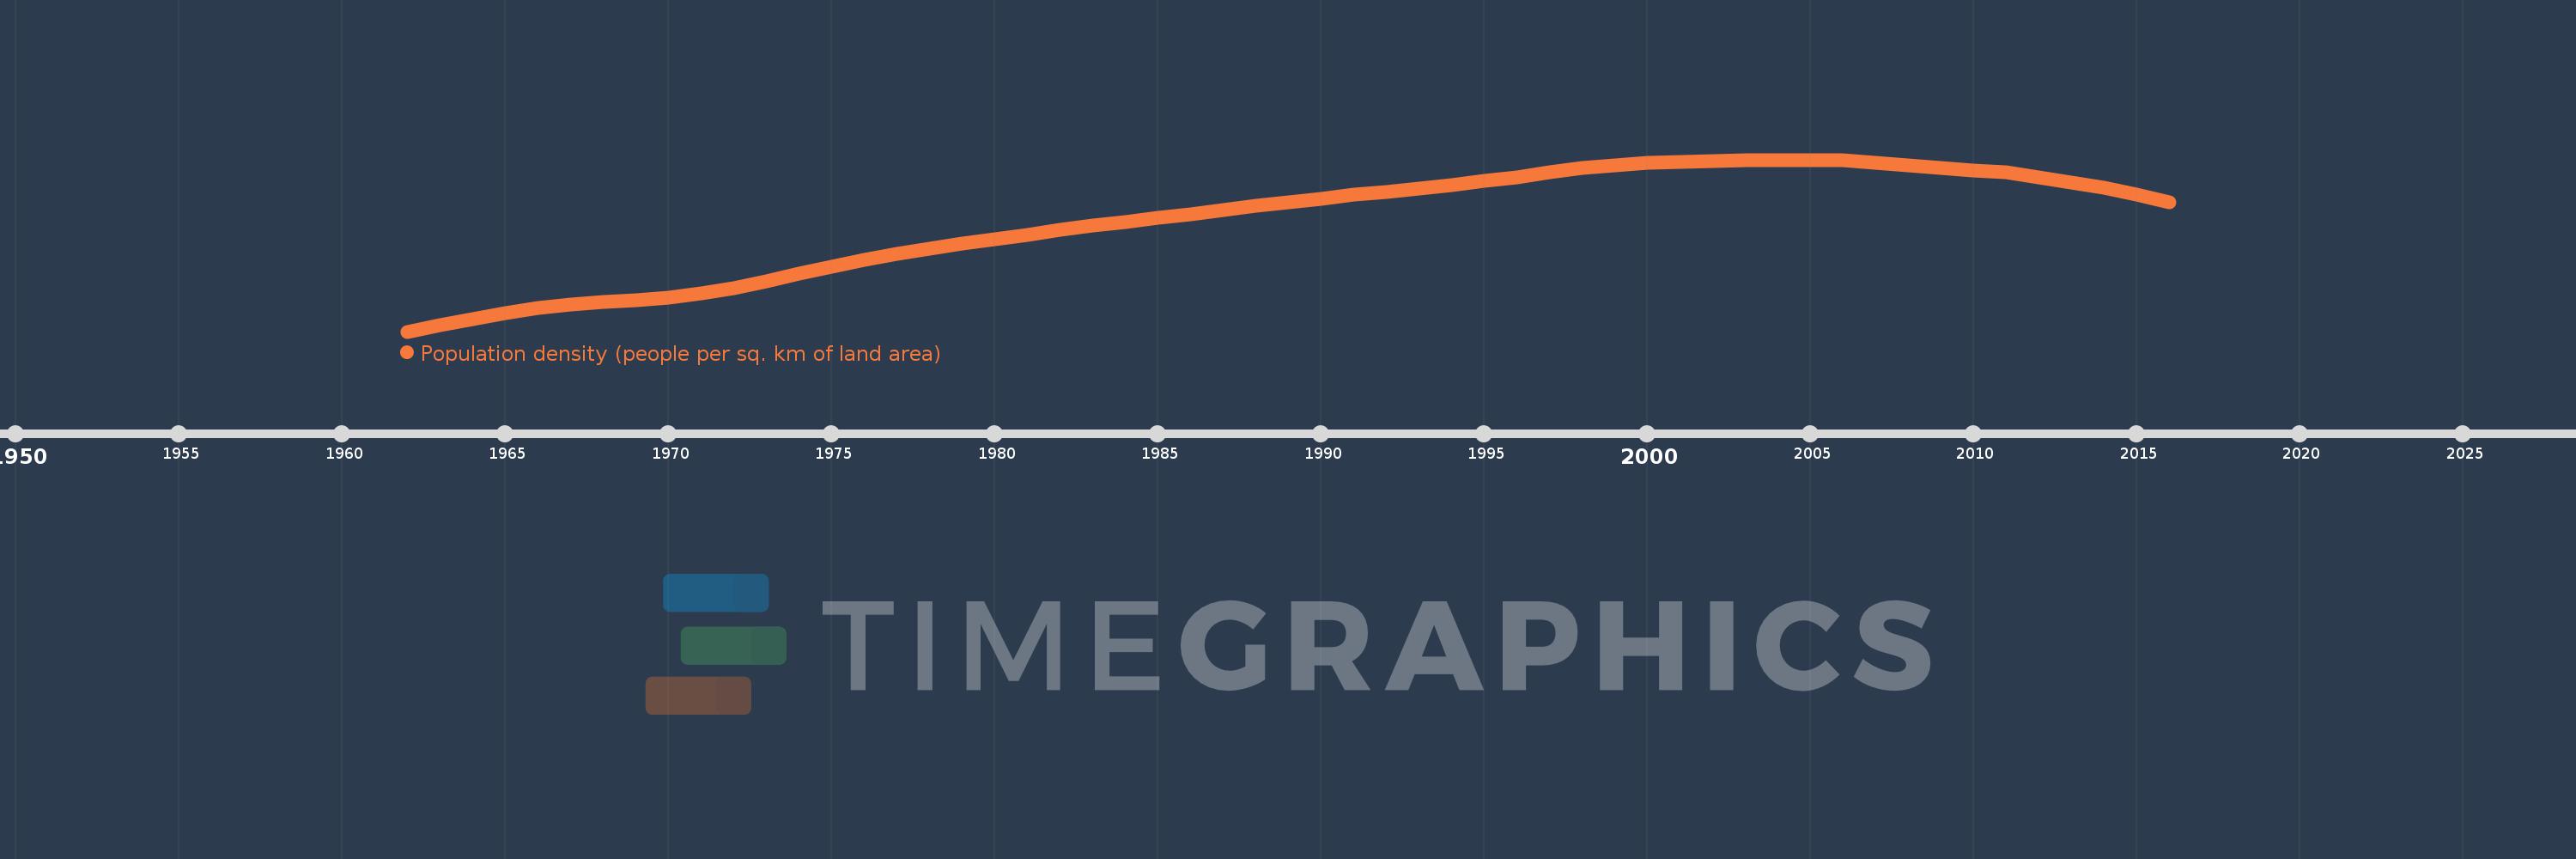
Population density (people per sq. km of land area)
2016,2015,2014,2013,2012,2011,2010,2009,2008,2007,2006,2005,2004,2003,2002,2001,2000,1999,1998,1997,1996,1995,1994,1993,1992,1991,1990,1989,1988,1987,1986,1985,1984,1983,1982,1981,1980,1979,1978,1977,1976,1975,1974,1973,1972,1971,1970,1969,1968,1967,1966,1965,1964,1963,1962
This statistics in other country:
AfghanistanAlbaniaAlgeriaAmerican SamoaAndorraAngolaAntigua and BarbudaArab WorldArgentinaArmeniaArubaAustraliaAustriaAzerbaijanBahamas, TheBahrainBangladeshBarbadosBelarusBelgiumBelizeBeninBermudaBhutanBoliviaBosnia and HerzegovinaBotswanaBrazilBritish Virgin IslandsBrunei DarussalamBulgariaBurkina FasoBurundiCabo VerdeCambodiaCameroonCanadaCaribbean small statesCayman IslandsCentral African RepublicCentral Europe and the BalticsChadChannel IslandsChileChinaColombiaComorosCongo, Dem. Rep.Congo, Rep.Costa RicaCote d'IvoireCroatiaCubaCuracaoCyprusCzech RepublicDenmarkDjiboutiDominicaDominican RepublicEarly-demographic dividendEast Asia & PacificEast Asia & Pacific (excluding high income)East Asia & Pacific (IDA & IBRD countries)EcuadorEgypt, Arab Rep.El SalvadorEquatorial GuineaEritreaEstoniaEthiopiaEuro areaEurope & Central AsiaEurope & Central Asia (excluding high income)Europe & Central Asia (IDA & IBRD countries)European UnionFaroe IslandsFijiFinlandFragile and conflict affected situationsFranceFrench PolynesiaGabonGambia, TheGeorgiaGermanyGhanaGibraltarGreeceGreenlandGrenadaGuamGuatemalaGuineaGuinea-BissauGuyanaHaitiHeavily indebted poor countries (HIPC)High incomeHondurasHong Kong SAR, ChinaHungaryIBRD onlyIcelandIDA & IBRD totalIDA blendIDA onlyIDA totalIndiaIndonesiaIran, Islamic Rep.IraqIrelandIsle of ManIsraelItalyJamaicaJapanJordanKazakhstanKenyaKiribatiKorea, Dem. People’s Rep.Korea, Rep.KosovoKuwaitKyrgyz RepublicLao PDRLate-demographic dividendLatin America & Caribbean Latin America & Caribbean (excluding high income)Latin America & the Caribbean (IDA & IBRD countries)LatviaLeast developed countries: UN classificationLebanonLesothoLiberiaLibyaLiechtensteinLithuaniaLow & middle incomeLow incomeLower middle incomeLuxembourgMacao SAR, ChinaMacedonia, FYRMadagascarMalawiMalaysiaMaldivesMaliMaltaMarshall IslandsMauritaniaMauritiusMexicoMicronesia, Fed. Sts.Middle East & North AfricaMiddle East & North Africa (excluding high income)Middle East & North Africa (IDA & IBRD countries)Middle incomeMoldovaMonacoMongoliaMontenegroMoroccoMozambiqueMyanmarNamibiaNauruNepalNetherlandsNew CaledoniaNew ZealandNicaraguaNigerNigeriaNorth AmericaNorthern Mariana IslandsNorwayOECD membersOmanOther small statesPacific island small statesPakistanPalauPanamaPapua New GuineaParaguayPeruPhilippinesPolandPortugalPost-demographic dividendPre-demographic dividendPuerto RicoQatarRomaniaRussian FederationRwandaSamoaSan MarinoSao Tome and PrincipeSaudi ArabiaSenegalSerbiaSeychellesSierra LeoneSingaporeSint Maarten (Dutch part)Slovak RepublicSloveniaSmall statesSolomon IslandsSomaliaSouth AfricaSouth AsiaSouth Asia (IDA & IBRD)SpainSri LankaSt. Kitts and NevisSt. LuciaSt. Martin (French part)St. Vincent and the GrenadinesSub-Saharan Africa Sub-Saharan Africa (excluding high income)Sub-Saharan Africa (IDA & IBRD countries)SudanSurinameSwazilandSwedenSwitzerlandSyrian Arab RepublicTajikistanTanzaniaThailandTimor-LesteTogoTongaTrinidad and TobagoTunisiaTurkeyTurkmenistanTurks and Caicos IslandsTuvaluUgandaUkraineUnited Arab EmiratesUnited KingdomUnited StatesUpper middle incomeUruguayUzbekistanVanuatuVenezuela, RBVietnamVirgin Islands (U.S.)West Bank and GazaWorldYemen, Rep.ZambiaZimbabwe Timeline:
This timeline shows a graph from 1962 to 2016 of Puerto Rico. No data until 1961. Number of actual observations by date: 55.
Source name:
World Development Indicators
Source organization:
Food and Agriculture Organization and World Bank population estimates.
Categories, topics:
Urban Development
Last updated:
apr 23, 2017
Indicators value changes by year
Minimum:
270.544
jan 1, 1962
Maximum:
431.441
jan 1, 2005
At the date of observation
Value
Absolute change
Change from previous value
jan 1, 1962
270.544
+270.544
0.0%
jan 1, 1963
276.248
+5.705
2.11%
jan 1, 1964
282.36
+6.111
2.21%
jan 1, 1965
287.944
+5.585
1.98%
jan 1, 1966
292.446
+4.502
1.56%
jan 1, 1967
295.941
+3.494
1.19%
jan 1, 1968
298.272
+2.331
0.79%
jan 1, 1969
300.12
+1.848
0.62%
jan 1, 1970
302.61
+2.49
0.83%
jan 1, 1971
306.426
+3.816
1.26%
jan 1, 1972
311.408
+4.982
1.63%
jan 1, 1973
317.616
+6.208
1.99%
jan 1, 1974
324.553
+6.937
2.18%
jan 1, 1975
331.375
+6.822
2.1%
jan 1, 1976
337.542
+6.167
1.86%
jan 1, 1977
343.163
+5.621
1.67%
jan 1, 1978
348.218
+5.055
1.47%
jan 1, 1979
352.81
+4.592
1.32%
jan 1, 1980
357.169
+4.359
1.24%
jan 1, 1981
361.443
+4.274
1.2%
jan 1, 1982
365.564
+4.121
1.14%
jan 1, 1983
369.499
+3.935
1.08%
jan 1, 1984
373.296
+3.798
1.03%
jan 1, 1985
377.023
+3.726
1.0%
jan 1, 1986
380.722
+3.699
0.98%
jan 1, 1987
384.392
+3.67
0.96%
jan 1, 1988
388.033
+3.641
0.95%
jan 1, 1989
391.646
+3.613
0.93%
jan 1, 1990
395.225
+3.58
0.91%
jan 1, 1991
398.76
+3.534
0.89%
jan 1, 1992
401.591
+2.831
0.71%
jan 1, 1993
404.191
+2.6
0.65%
jan 1, 1994
407.61
+3.418
0.85%
jan 1, 1995
411.413
+3.804
0.93%
jan 1, 1996
415.231
+3.818
0.93%
jan 1, 1997
419.916
+4.685
1.13%
jan 1, 1998
423.837
+3.921
0.93%
jan 1, 1999
426.28
+2.443
0.58%
jan 1, 2000
428.42
+2.14
0.5%
jan 1, 2001
429.606
+1.186
0.28%
jan 1, 2002
430.527
+0.921
0.21%
jan 1, 2003
431.082
+0.555
0.13%
jan 1, 2004
431.352
+0.27
0.06%
jan 1, 2005
431.441
+0.088
0.02%
jan 1, 2006
430.819
-0.622
-0.14%
jan 1, 2007
428.998
-1.821
-0.42%
jan 1, 2008
426.493
-2.505
-0.58%
jan 1, 2009
423.998
-2.495
-0.58%
jan 1, 2010
421.692
-2.306
-0.54%
jan 1, 2011
419.563
-2.129
-0.5%
jan 1, 2012
414.739
-4.824
-1.15%
jan 1, 2013
409.751
-4.989
-1.2%
jan 1, 2014
405.082
-4.668
-1.14%
jan 1, 2015
398.522
-6.56
-1.62%
jan 1, 2016
391.678
-6.844
-1.72%
Ranking of countries by current statistics by years


Comments: