29
/
en
AIzaSyAYiBZKx7MnpbEhh9jyipgxe19OcubqV5w
April 1, 2024
279158
Uzbekistan
UZB
true
2
1
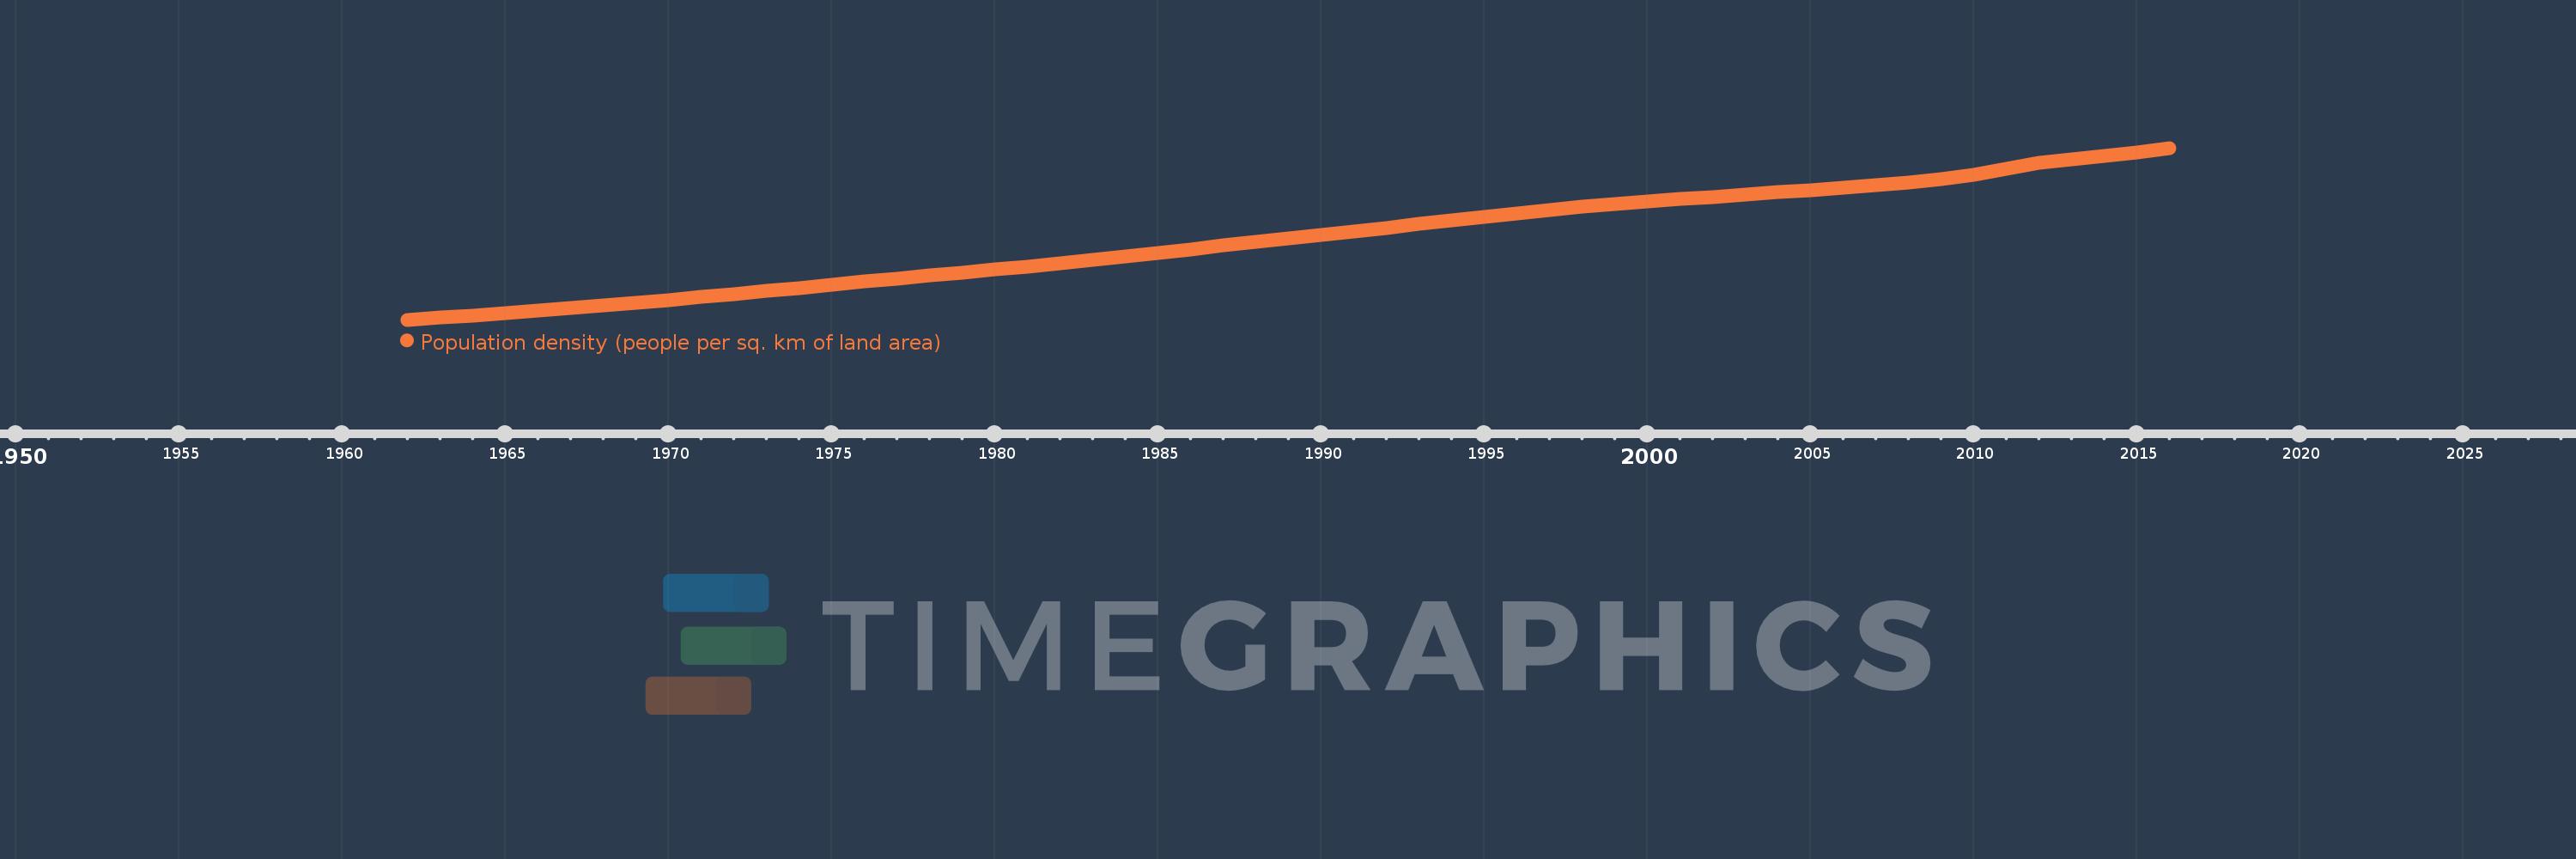
Population density (people per sq. km of land area)
2016,2015,2014,2013,2012,2011,2010,2009,2008,2007,2006,2005,2004,2003,2002,2001,2000,1999,1998,1997,1996,1995,1994,1993,1992,1991,1990,1989,1988,1987,1986,1985,1984,1983,1982,1981,1980,1979,1978,1977,1976,1975,1974,1973,1972,1971,1970,1969,1968,1967,1966,1965,1964,1963,1962
This statistics in other country:
AfghanistanAlbaniaAlgeriaAmerican SamoaAndorraAngolaAntigua and BarbudaArab WorldArgentinaArmeniaArubaAustraliaAustriaAzerbaijanBahamas, TheBahrainBangladeshBarbadosBelarusBelgiumBelizeBeninBermudaBhutanBoliviaBosnia and HerzegovinaBotswanaBrazilBritish Virgin IslandsBrunei DarussalamBulgariaBurkina FasoBurundiCabo VerdeCambodiaCameroonCanadaCaribbean small statesCayman IslandsCentral African RepublicCentral Europe and the BalticsChadChannel IslandsChileChinaColombiaComorosCongo, Dem. Rep.Congo, Rep.Costa RicaCote d'IvoireCroatiaCubaCuracaoCyprusCzech RepublicDenmarkDjiboutiDominicaDominican RepublicEarly-demographic dividendEast Asia & PacificEast Asia & Pacific (excluding high income)East Asia & Pacific (IDA & IBRD countries)EcuadorEgypt, Arab Rep.El SalvadorEquatorial GuineaEritreaEstoniaEthiopiaEuro areaEurope & Central AsiaEurope & Central Asia (excluding high income)Europe & Central Asia (IDA & IBRD countries)European UnionFaroe IslandsFijiFinlandFragile and conflict affected situationsFranceFrench PolynesiaGabonGambia, TheGeorgiaGermanyGhanaGibraltarGreeceGreenlandGrenadaGuamGuatemalaGuineaGuinea-BissauGuyanaHaitiHeavily indebted poor countries (HIPC)High incomeHondurasHong Kong SAR, ChinaHungaryIBRD onlyIcelandIDA & IBRD totalIDA blendIDA onlyIDA totalIndiaIndonesiaIran, Islamic Rep.IraqIrelandIsle of ManIsraelItalyJamaicaJapanJordanKazakhstanKenyaKiribatiKorea, Dem. People’s Rep.Korea, Rep.KosovoKuwaitKyrgyz RepublicLao PDRLate-demographic dividendLatin America & Caribbean Latin America & Caribbean (excluding high income)Latin America & the Caribbean (IDA & IBRD countries)LatviaLeast developed countries: UN classificationLebanonLesothoLiberiaLibyaLiechtensteinLithuaniaLow & middle incomeLow incomeLower middle incomeLuxembourgMacao SAR, ChinaMacedonia, FYRMadagascarMalawiMalaysiaMaldivesMaliMaltaMarshall IslandsMauritaniaMauritiusMexicoMicronesia, Fed. Sts.Middle East & North AfricaMiddle East & North Africa (excluding high income)Middle East & North Africa (IDA & IBRD countries)Middle incomeMoldovaMonacoMongoliaMontenegroMoroccoMozambiqueMyanmarNamibiaNauruNepalNetherlandsNew CaledoniaNew ZealandNicaraguaNigerNigeriaNorth AmericaNorthern Mariana IslandsNorwayOECD membersOmanOther small statesPacific island small statesPakistanPalauPanamaPapua New GuineaParaguayPeruPhilippinesPolandPortugalPost-demographic dividendPre-demographic dividendPuerto RicoQatarRomaniaRussian FederationRwandaSamoaSan MarinoSao Tome and PrincipeSaudi ArabiaSenegalSerbiaSeychellesSierra LeoneSingaporeSint Maarten (Dutch part)Slovak RepublicSloveniaSmall statesSolomon IslandsSomaliaSouth AfricaSouth AsiaSouth Asia (IDA & IBRD)SpainSri LankaSt. Kitts and NevisSt. LuciaSt. Martin (French part)St. Vincent and the GrenadinesSub-Saharan Africa Sub-Saharan Africa (excluding high income)Sub-Saharan Africa (IDA & IBRD countries)SudanSurinameSwazilandSwedenSwitzerlandSyrian Arab RepublicTajikistanTanzaniaThailandTimor-LesteTogoTongaTrinidad and TobagoTunisiaTurkeyTurkmenistanTurks and Caicos IslandsTuvaluUgandaUkraineUnited Arab EmiratesUnited KingdomUnited StatesUpper middle incomeUruguayUzbekistanVanuatuVenezuela, RBVietnamVirgin Islands (U.S.)West Bank and GazaWorldYemen, Rep.ZambiaZimbabwe Timeline:
This timeline shows a graph from 1962 to 2016 of Uzbekistan. No data until 1961. Number of actual observations by date: 55.
Source name:
World Development Indicators
Source organization:
Food and Agriculture Organization and World Bank population estimates.
Categories, topics:
Urban Development
Last updated:
apr 23, 2017
Indicators value changes by year
Minimum:
21.262
jan 1, 1962
Maximum:
73.575
jan 1, 2016
At the date of observation
Value
Absolute change
Change from previous value
jan 1, 1962
21.262
+21.262
0.0%
jan 1, 1963
21.908
+0.646
3.04%
jan 1, 1964
22.594
+0.687
3.13%
jan 1, 1965
23.313
+0.718
3.18%
jan 1, 1966
24.056
+0.744
3.19%
jan 1, 1967
24.821
+0.765
3.18%
jan 1, 1968
25.61
+0.788
3.18%
jan 1, 1969
26.423
+0.814
3.18%
jan 1, 1970
27.268
+0.844
3.2%
jan 1, 1971
28.145
+0.877
3.22%
jan 1, 1972
29.058
+0.913
3.24%
jan 1, 1973
30.001
+0.943
3.25%
jan 1, 1974
30.961
+0.96
3.2%
jan 1, 1975
31.92
+0.959
3.1%
jan 1, 1976
32.866
+0.945
2.96%
jan 1, 1977
33.791
+0.926
2.82%
jan 1, 1978
34.702
+0.911
2.7%
jan 1, 1979
35.611
+0.909
2.62%
jan 1, 1980
36.539
+0.928
2.6%
jan 1, 1981
37.499
+0.96
2.63%
jan 1, 1982
38.494
+0.995
2.65%
jan 1, 1983
39.518
+1.024
2.66%
jan 1, 1984
40.568
+1.05
2.66%
jan 1, 1985
41.638
+1.07
2.64%
jan 1, 1986
42.722
+1.084
2.6%
jan 1, 1987
43.819
+1.096
2.57%
jan 1, 1988
44.926
+1.107
2.53%
jan 1, 1989
46.035
+1.109
2.47%
jan 1, 1990
47.137
+1.103
2.4%
jan 1, 1991
48.213
+1.076
2.28%
jan 1, 1992
49.252
+1.039
2.16%
jan 1, 1993
50.421
+1.168
2.37%
jan 1, 1994
51.58
+1.159
2.3%
jan 1, 1995
52.602
+1.023
1.98%
jan 1, 1996
53.561
+0.959
1.82%
jan 1, 1997
54.596
+1.034
1.93%
jan 1, 1998
55.635
+1.039
1.9%
jan 1, 1999
56.537
+0.903
1.62%
jan 1, 2000
57.15
+0.613
1.08%
jan 1, 2001
57.946
+0.796
1.39%
jan 1, 2002
58.685
+0.738
1.27%
jan 1, 2003
59.407
+0.723
1.23%
jan 1, 2004
60.103
+0.695
1.17%
jan 1, 2005
60.8
+0.697
1.16%
jan 1, 2006
61.512
+0.711
1.17%
jan 1, 2007
62.267
+0.755
1.23%
jan 1, 2008
63.159
+0.893
1.43%
jan 1, 2009
64.181
+1.022
1.62%
jan 1, 2010
65.274
+1.092
1.7%
jan 1, 2011
67.142
+1.869
2.86%
jan 1, 2012
68.969
+1.827
2.72%
jan 1, 2013
69.992
+1.023
1.48%
jan 1, 2014
71.094
+1.102
1.57%
jan 1, 2015
72.303
+1.209
1.7%
jan 1, 2016
73.575
+1.272
1.76%
Ranking of countries by current statistics by years


Comments: