29
/
en
AIzaSyAYiBZKx7MnpbEhh9jyipgxe19OcubqV5w
April 1, 2024
247946
Spain
ESP
true
2
1
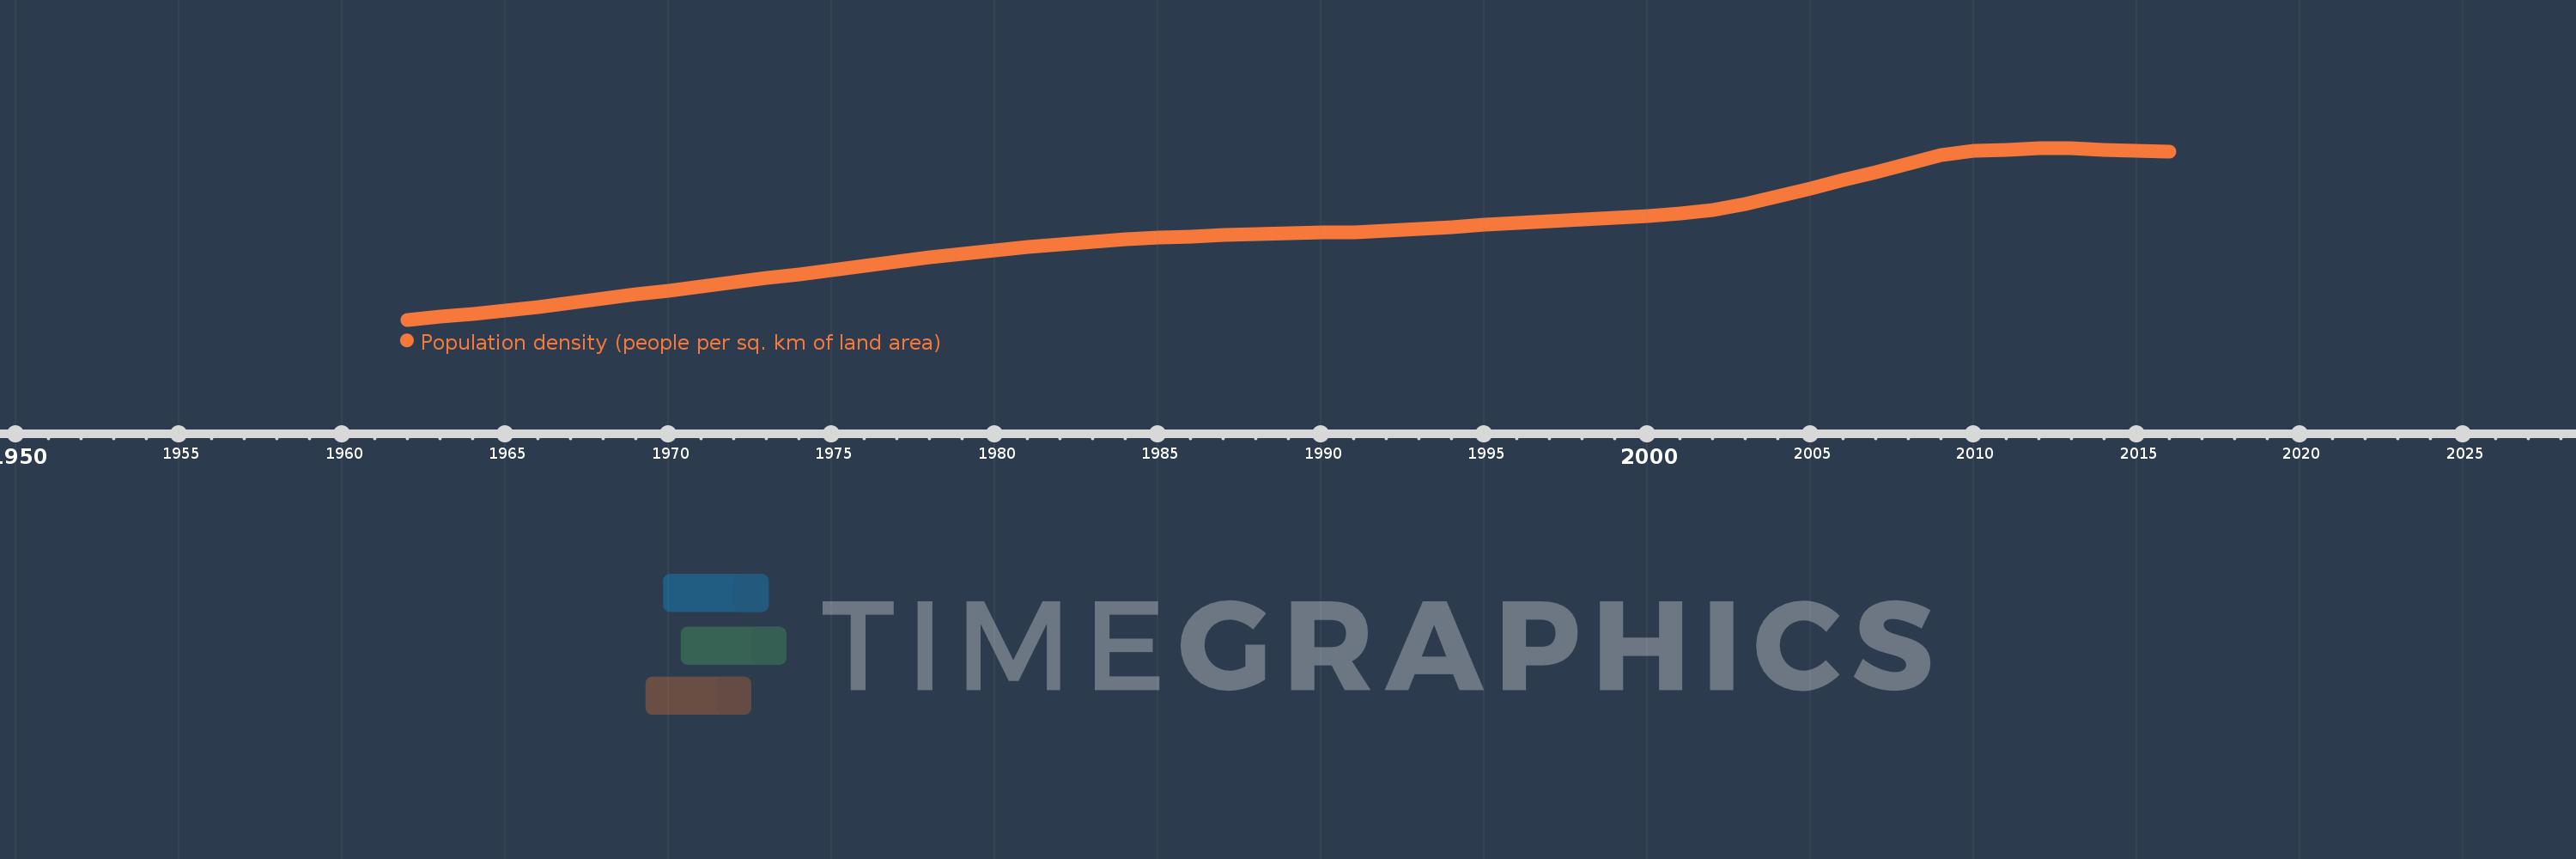
Population density (people per sq. km of land area)
2016,2015,2014,2013,2012,2011,2010,2009,2008,2007,2006,2005,2004,2003,2002,2001,2000,1999,1998,1997,1996,1995,1994,1993,1992,1991,1990,1989,1988,1987,1986,1985,1984,1983,1982,1981,1980,1979,1978,1977,1976,1975,1974,1973,1972,1971,1970,1969,1968,1967,1966,1965,1964,1963,1962
This statistics in other country:
AfghanistanAlbaniaAlgeriaAmerican SamoaAndorraAngolaAntigua and BarbudaArab WorldArgentinaArmeniaArubaAustraliaAustriaAzerbaijanBahamas, TheBahrainBangladeshBarbadosBelarusBelgiumBelizeBeninBermudaBhutanBoliviaBosnia and HerzegovinaBotswanaBrazilBritish Virgin IslandsBrunei DarussalamBulgariaBurkina FasoBurundiCabo VerdeCambodiaCameroonCanadaCaribbean small statesCayman IslandsCentral African RepublicCentral Europe and the BalticsChadChannel IslandsChileChinaColombiaComorosCongo, Dem. Rep.Congo, Rep.Costa RicaCote d'IvoireCroatiaCubaCuracaoCyprusCzech RepublicDenmarkDjiboutiDominicaDominican RepublicEarly-demographic dividendEast Asia & PacificEast Asia & Pacific (excluding high income)East Asia & Pacific (IDA & IBRD countries)EcuadorEgypt, Arab Rep.El SalvadorEquatorial GuineaEritreaEstoniaEthiopiaEuro areaEurope & Central AsiaEurope & Central Asia (excluding high income)Europe & Central Asia (IDA & IBRD countries)European UnionFaroe IslandsFijiFinlandFragile and conflict affected situationsFranceFrench PolynesiaGabonGambia, TheGeorgiaGermanyGhanaGibraltarGreeceGreenlandGrenadaGuamGuatemalaGuineaGuinea-BissauGuyanaHaitiHeavily indebted poor countries (HIPC)High incomeHondurasHong Kong SAR, ChinaHungaryIBRD onlyIcelandIDA & IBRD totalIDA blendIDA onlyIDA totalIndiaIndonesiaIran, Islamic Rep.IraqIrelandIsle of ManIsraelItalyJamaicaJapanJordanKazakhstanKenyaKiribatiKorea, Dem. People’s Rep.Korea, Rep.KosovoKuwaitKyrgyz RepublicLao PDRLate-demographic dividendLatin America & Caribbean Latin America & Caribbean (excluding high income)Latin America & the Caribbean (IDA & IBRD countries)LatviaLeast developed countries: UN classificationLebanonLesothoLiberiaLibyaLiechtensteinLithuaniaLow & middle incomeLow incomeLower middle incomeLuxembourgMacao SAR, ChinaMacedonia, FYRMadagascarMalawiMalaysiaMaldivesMaliMaltaMarshall IslandsMauritaniaMauritiusMexicoMicronesia, Fed. Sts.Middle East & North AfricaMiddle East & North Africa (excluding high income)Middle East & North Africa (IDA & IBRD countries)Middle incomeMoldovaMonacoMongoliaMontenegroMoroccoMozambiqueMyanmarNamibiaNauruNepalNetherlandsNew CaledoniaNew ZealandNicaraguaNigerNigeriaNorth AmericaNorthern Mariana IslandsNorwayOECD membersOmanOther small statesPacific island small statesPakistanPalauPanamaPapua New GuineaParaguayPeruPhilippinesPolandPortugalPost-demographic dividendPre-demographic dividendPuerto RicoQatarRomaniaRussian FederationRwandaSamoaSan MarinoSao Tome and PrincipeSaudi ArabiaSenegalSerbiaSeychellesSierra LeoneSingaporeSint Maarten (Dutch part)Slovak RepublicSloveniaSmall statesSolomon IslandsSomaliaSouth AfricaSouth AsiaSouth Asia (IDA & IBRD)SpainSri LankaSt. Kitts and NevisSt. LuciaSt. Martin (French part)St. Vincent and the GrenadinesSub-Saharan Africa Sub-Saharan Africa (excluding high income)Sub-Saharan Africa (IDA & IBRD countries)SudanSurinameSwazilandSwedenSwitzerlandSyrian Arab RepublicTajikistanTanzaniaThailandTimor-LesteTogoTongaTrinidad and TobagoTunisiaTurkeyTurkmenistanTurks and Caicos IslandsTuvaluUgandaUkraineUnited Arab EmiratesUnited KingdomUnited StatesUpper middle incomeUruguayUzbekistanVanuatuVenezuela, RBVietnamVirgin Islands (U.S.)West Bank and GazaWorldYemen, Rep.ZambiaZimbabwe Timeline:
This timeline shows a graph from 1962 to 2016 of Spain. No data until 1961. Number of actual observations by date: 55.
Source name:
World Development Indicators
Source organization:
Food and Agriculture Organization and World Bank population estimates.
Categories, topics:
Urban Development
Last updated:
apr 23, 2017
Indicators value changes by year
Minimum:
61.506
jan 1, 1962
Maximum:
93.508
jan 1, 2012
At the date of observation
Value
Absolute change
Change from previous value
jan 1, 1962
61.506
+61.506
0.0%
jan 1, 1963
62.074
+0.568
0.92%
jan 1, 1964
62.621
+0.547
0.88%
jan 1, 1965
63.246
+0.625
1.0%
jan 1, 1966
63.937
+0.69
1.09%
jan 1, 1967
64.595
+0.658
1.03%
jan 1, 1968
65.395
+0.8
1.24%
jan 1, 1969
66.255
+0.861
1.32%
jan 1, 1970
66.912
+0.656
0.99%
jan 1, 1971
67.659
+0.747
1.12%
jan 1, 1972
68.479
+0.82
1.21%
jan 1, 1973
69.239
+0.76
1.11%
jan 1, 1974
70.009
+0.769
1.11%
jan 1, 1975
70.782
+0.773
1.1%
jan 1, 1976
71.569
+0.787
1.11%
jan 1, 1977
72.338
+0.769
1.07%
jan 1, 1978
73.091
+0.753
1.04%
jan 1, 1979
73.799
+0.709
0.97%
jan 1, 1980
74.451
+0.652
0.88%
jan 1, 1981
75.062
+0.611
0.82%
jan 1, 1982
75.599
+0.537
0.72%
jan 1, 1983
76.054
+0.455
0.6%
jan 1, 1984
76.43
+0.376
0.49%
jan 1, 1985
76.747
+0.317
0.41%
jan 1, 1986
77.025
+0.279
0.36%
jan 1, 1987
77.256
+0.23
0.3%
jan 1, 1988
77.456
+0.201
0.26%
jan 1, 1989
77.621
+0.164
0.21%
jan 1, 1990
77.743
+0.122
0.16%
jan 1, 1991
77.822
+0.079
0.1%
jan 1, 1992
78.02
+0.198
0.25%
jan 1, 1993
78.403
+0.383
0.49%
jan 1, 1994
78.811
+0.408
0.52%
jan 1, 1995
79.187
+0.376
0.48%
jan 1, 1996
79.537
+0.35
0.44%
jan 1, 1997
79.869
+0.332
0.42%
jan 1, 1998
80.205
+0.335
0.42%
jan 1, 1999
80.537
+0.333
0.41%
jan 1, 2000
80.864
+0.327
0.41%
jan 1, 2001
81.298
+0.434
0.54%
jan 1, 2002
81.943
+0.645
0.79%
jan 1, 2003
83.023
+1.079
1.32%
jan 1, 2004
84.509
+1.486
1.79%
jan 1, 2005
85.985
+1.476
1.75%
jan 1, 2006
87.465
+1.481
1.72%
jan 1, 2007
88.976
+1.511
1.73%
jan 1, 2008
90.615
+1.639
1.84%
jan 1, 2009
92.129
+1.514
1.67%
jan 1, 2010
92.975
+0.846
0.92%
jan 1, 2011
93.152
+0.177
0.19%
jan 1, 2012
93.508
+0.356
0.38%
jan 1, 2013
93.507
-0.001
0.0%
jan 1, 2014
93.201
-0.306
-0.33%
jan 1, 2015
92.923
-0.278
-0.3%
jan 1, 2016
92.849
-0.074
-0.08%
Ranking of countries by current statistics by years


Comments: